

Where are your Franchise Sales Deals slowing down?
Compare your Closed Lost and Closed Won Franchise Deals to find bottlenecks.

In this Lab Report:
If you want to know whether a Deal in progress is good or bad, compare it to deals that you win. Is a Deal moving slowly or quickly? How long should Reps be working Deals with Prospective Zees who are excited but nervous–where are they slowing down? Let’s get you some data to work with.
Why This Matters
We’d all rather spend time focusing on the leads that will close and not the ones that won’t.
It’s always painful to give up on those leads that are excited and engaging in your Franchise Sales process but are uncertain or nervous. They’re not going fast, but also aren’t dropping out. So how do you know when you’ve been actively working them too long?
The time that Deals spend in each stage becomes a useful predictor of whether a Deal is going to win or lose, if your Franchise Sales Pipeline set up correctly, your is data clean, and your sales process is humming.
That report at the top of this Lab Report is a great example of a Franchisor having their Pipeline set up but not yet getting things cleaned up and in order.
What this report shows
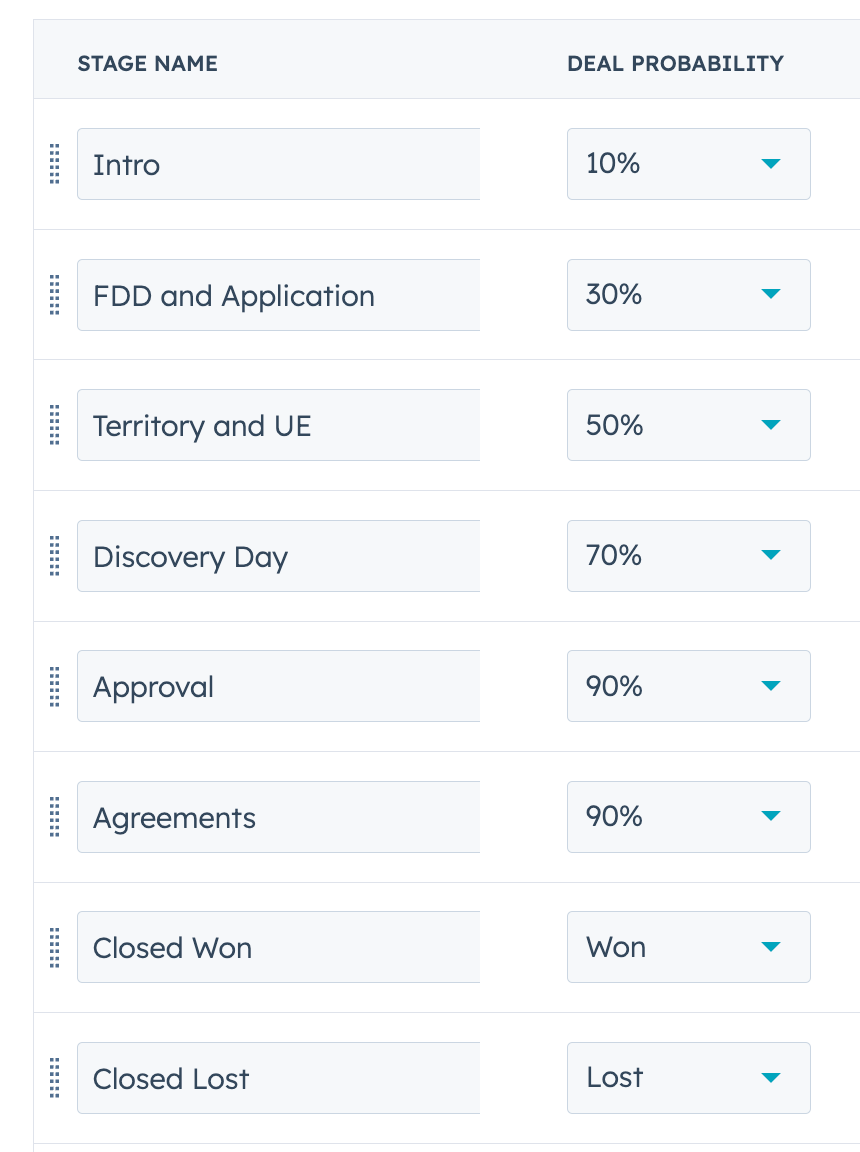
For the data we’re looking at here, this is what the Franchise Sales Pipeline looks like:
Each bar in the report represents one of the Open stages in the Franchise sales pipeline. E.g. it does not include Closed Won or Closed Lost. The bars on the left-hand side represent Closed Lost deals. The bar on the right hand side represent Closed Won deals.
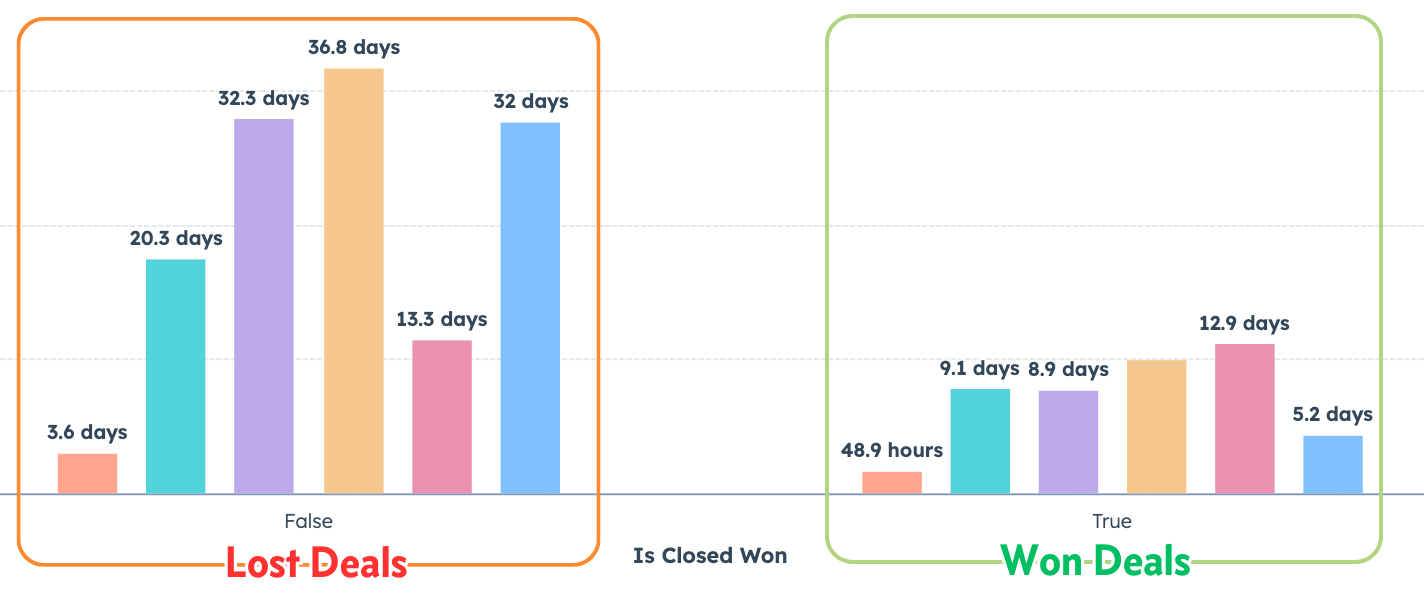
The height of the bars represent how long on average Deals that went on to be Lost (on the left) or Won (on the right) that entered each stage spent in that stage.
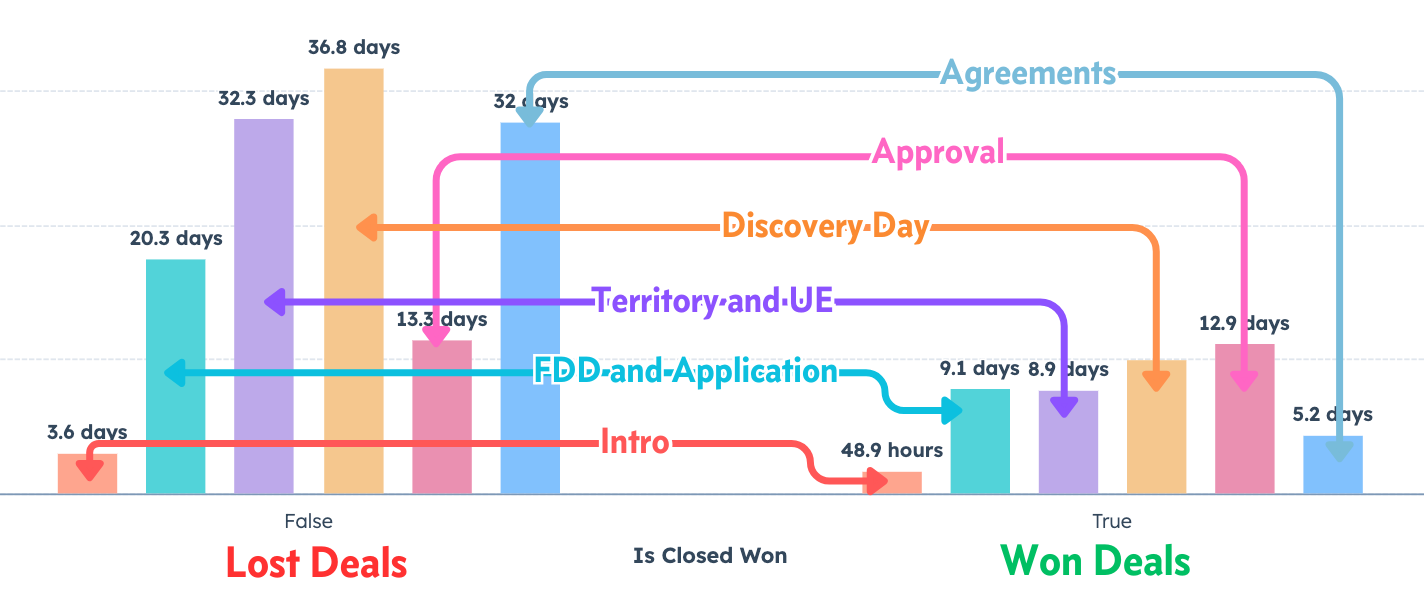
Example:
The purple bar on both sides of the graph is the Territory and Unit Economics stage of the pipeline. Deals that are Lost from Territory and Unit Economics spend, on average, 32.3 days in that stage. Deals that go on to win spend an average of 8.9 days there.
So at a glance, by comparing the bars of the same color you can see how much longer deals that you lose stick around.
We aren’t trying to hit goals here necessarily. The point of this graph is to help us quickly hone in on things like:
What stages do Lost Deals get hung up in?
How long is “too long” for a Deal to be in a Stage?
Where should we focus first to unbottleneck our pipeline?
For example, look at Approval, the pink bar.
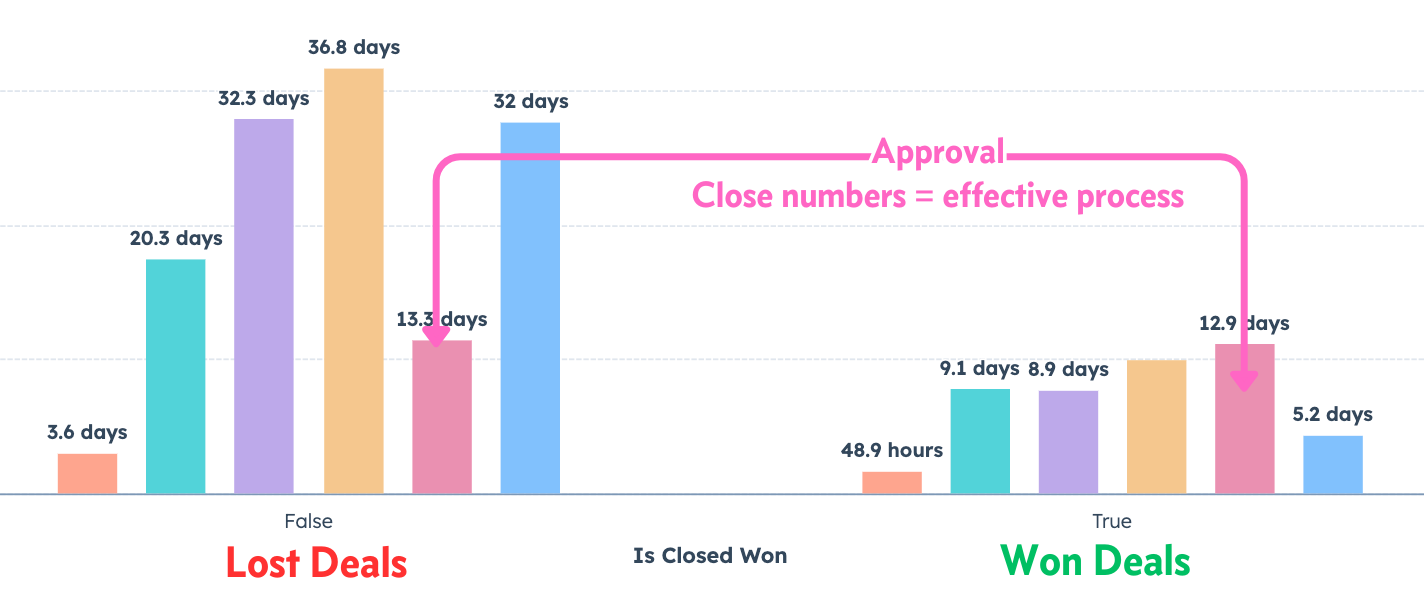
They’re doing a pretty good job consistently acting on the review and approval process and delivering the news to the prospective franchisee. Maybe they could be faster but the numbers for Lost and Won Deals are really close. That’s good. That’s an effective step in the sales process.
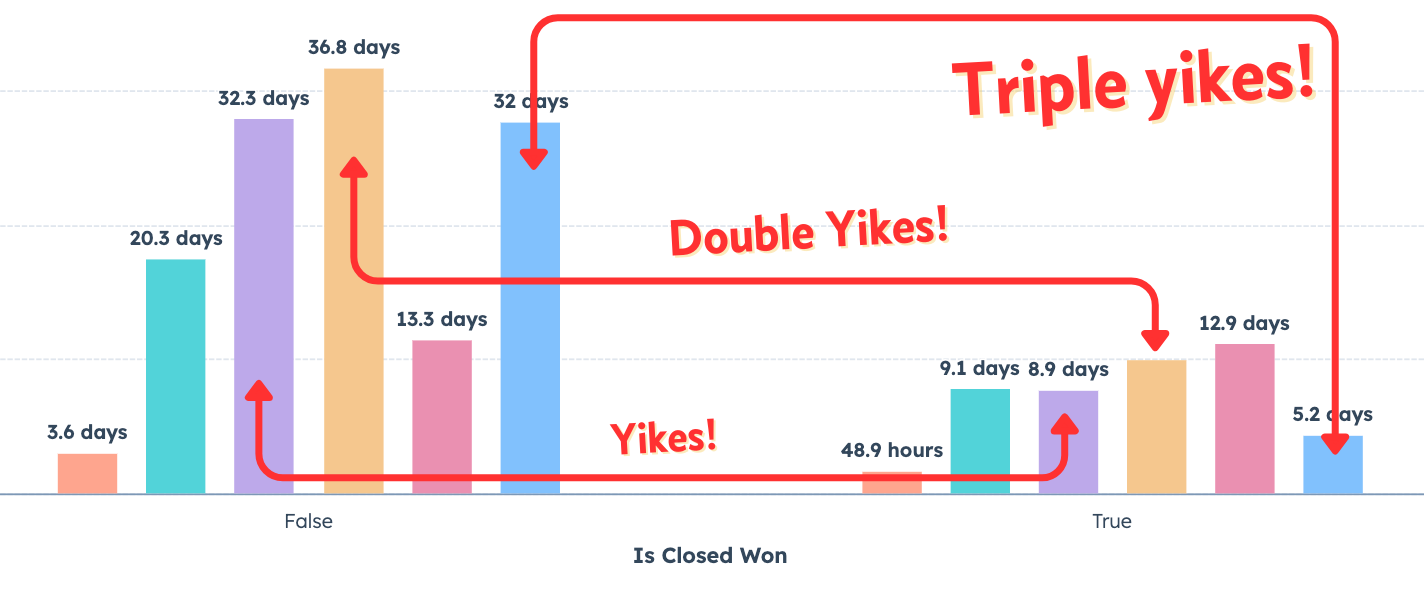
But there are some problems. Since we have some tall bars, let’s drill down into the data:
What we see here:
Yikes: Territory and UE, Closed Lost spend almost 3x as long in the stage.
Double Yikes: Discovery Day, more than 3x longer in the stage.
Triple Yikes: Agreements 6x longer at the end of the sale
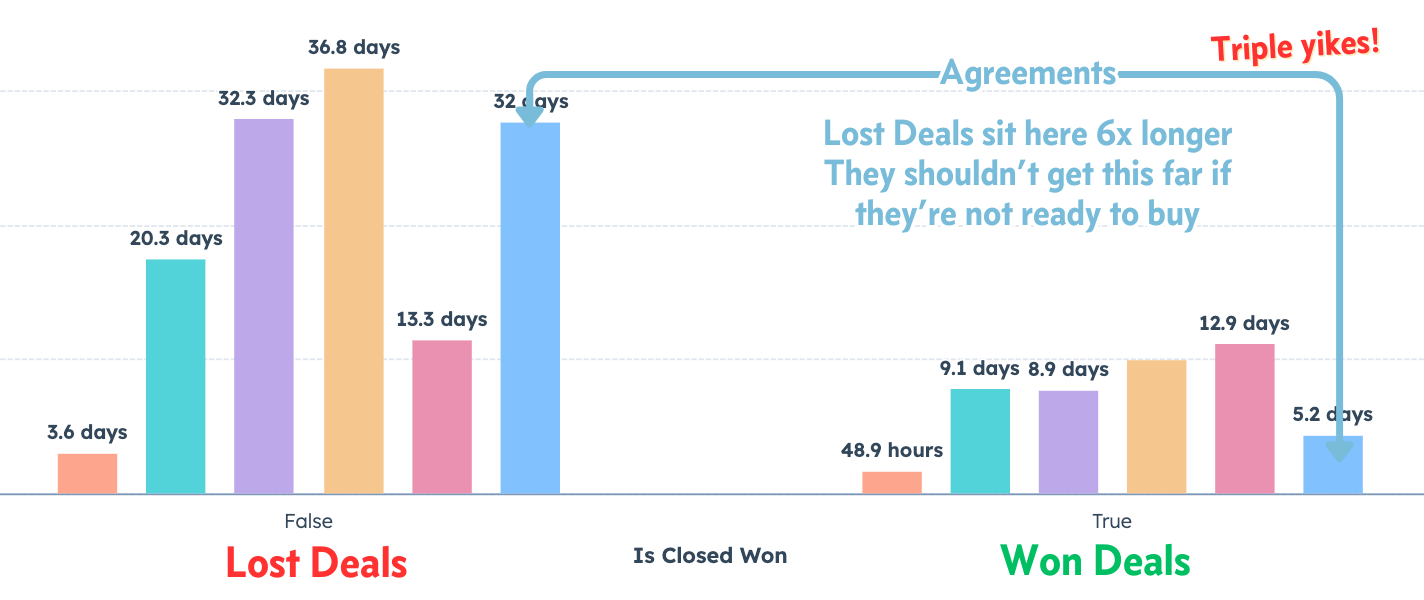
Based on these numbers, by the time a Prospective Franchisee has had the signing package in hand for 2 weeks, sirens and alarm bells should be going off. What’s going on there?
Here’s how to build this report for your Franchise Sales Pipeline in HubSpot
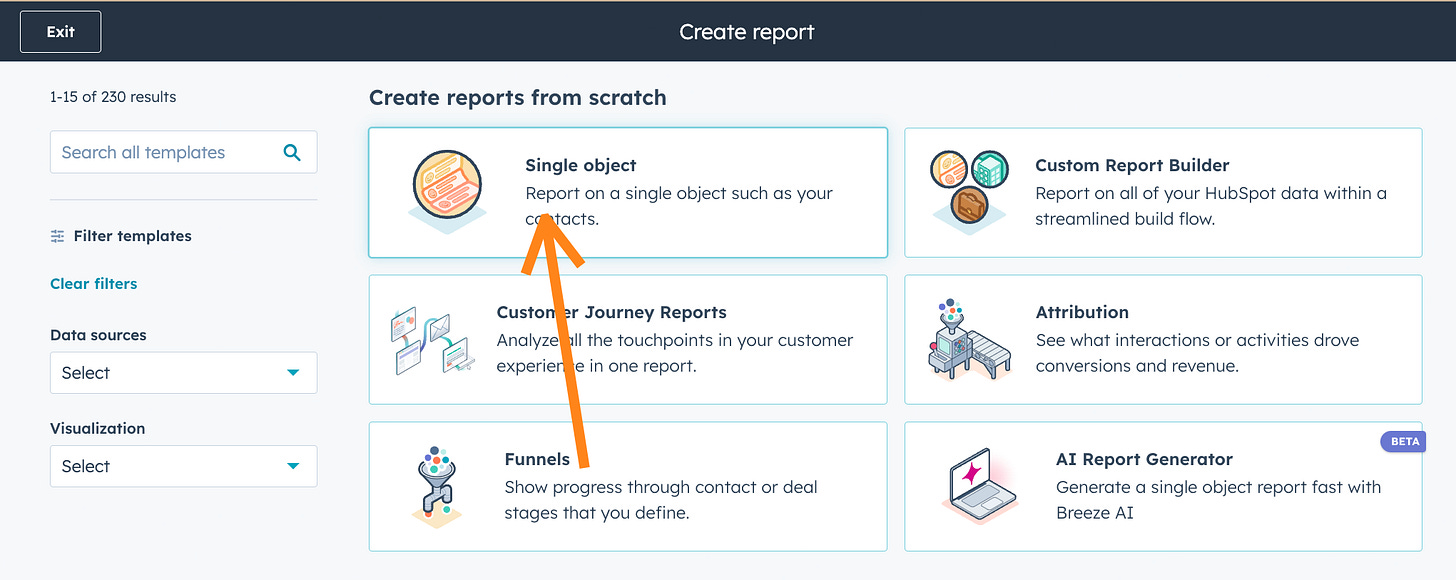
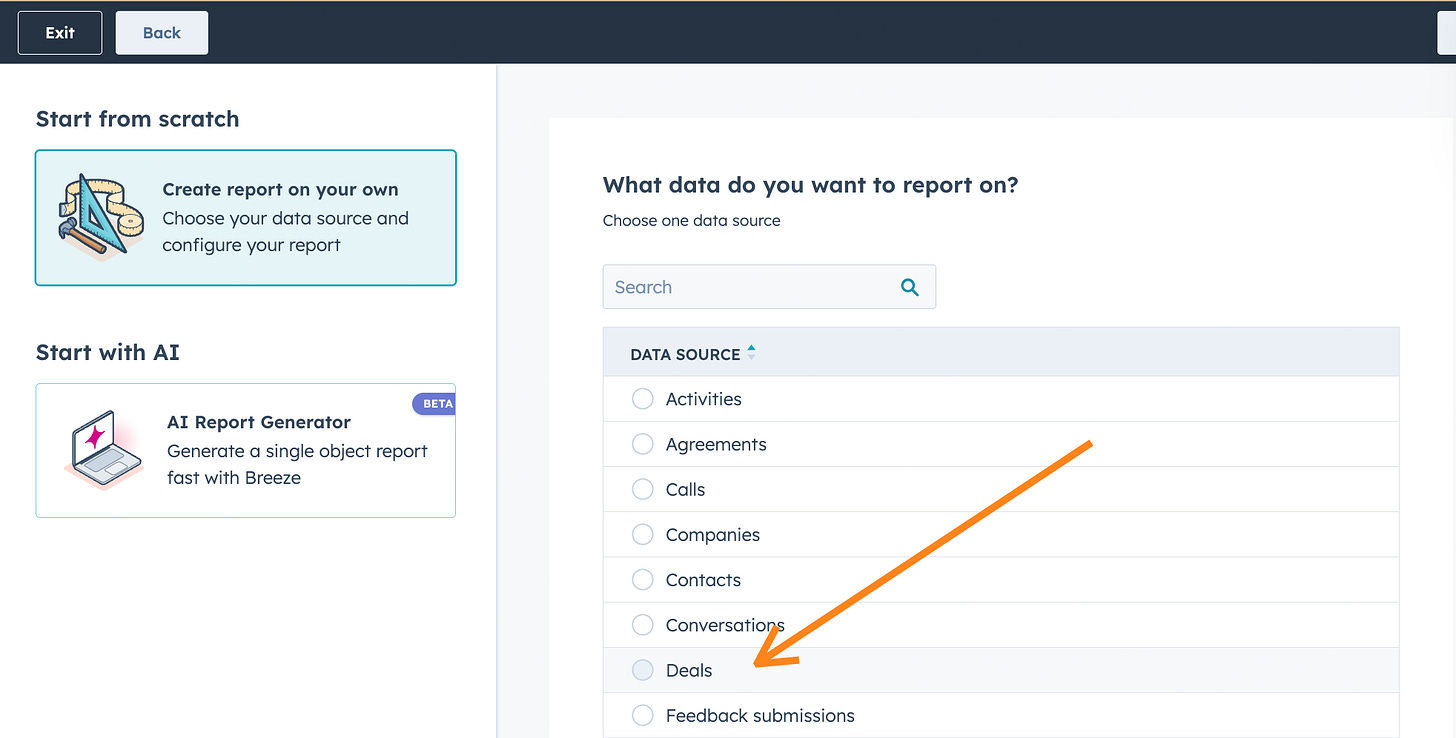
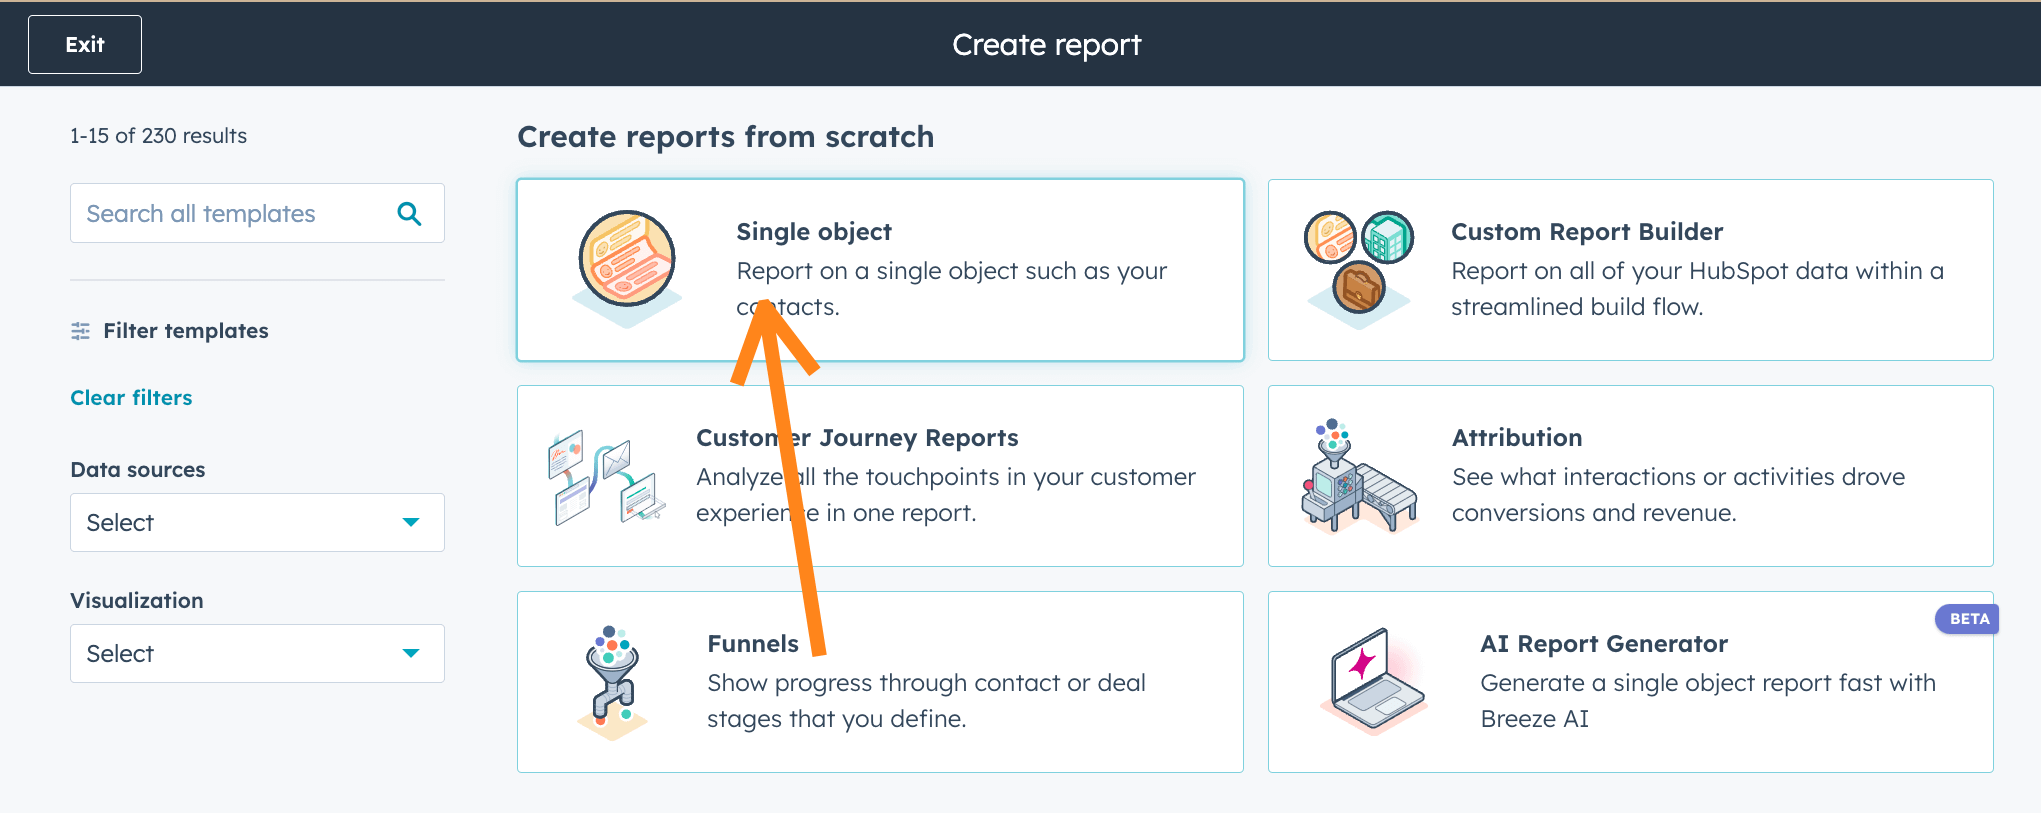
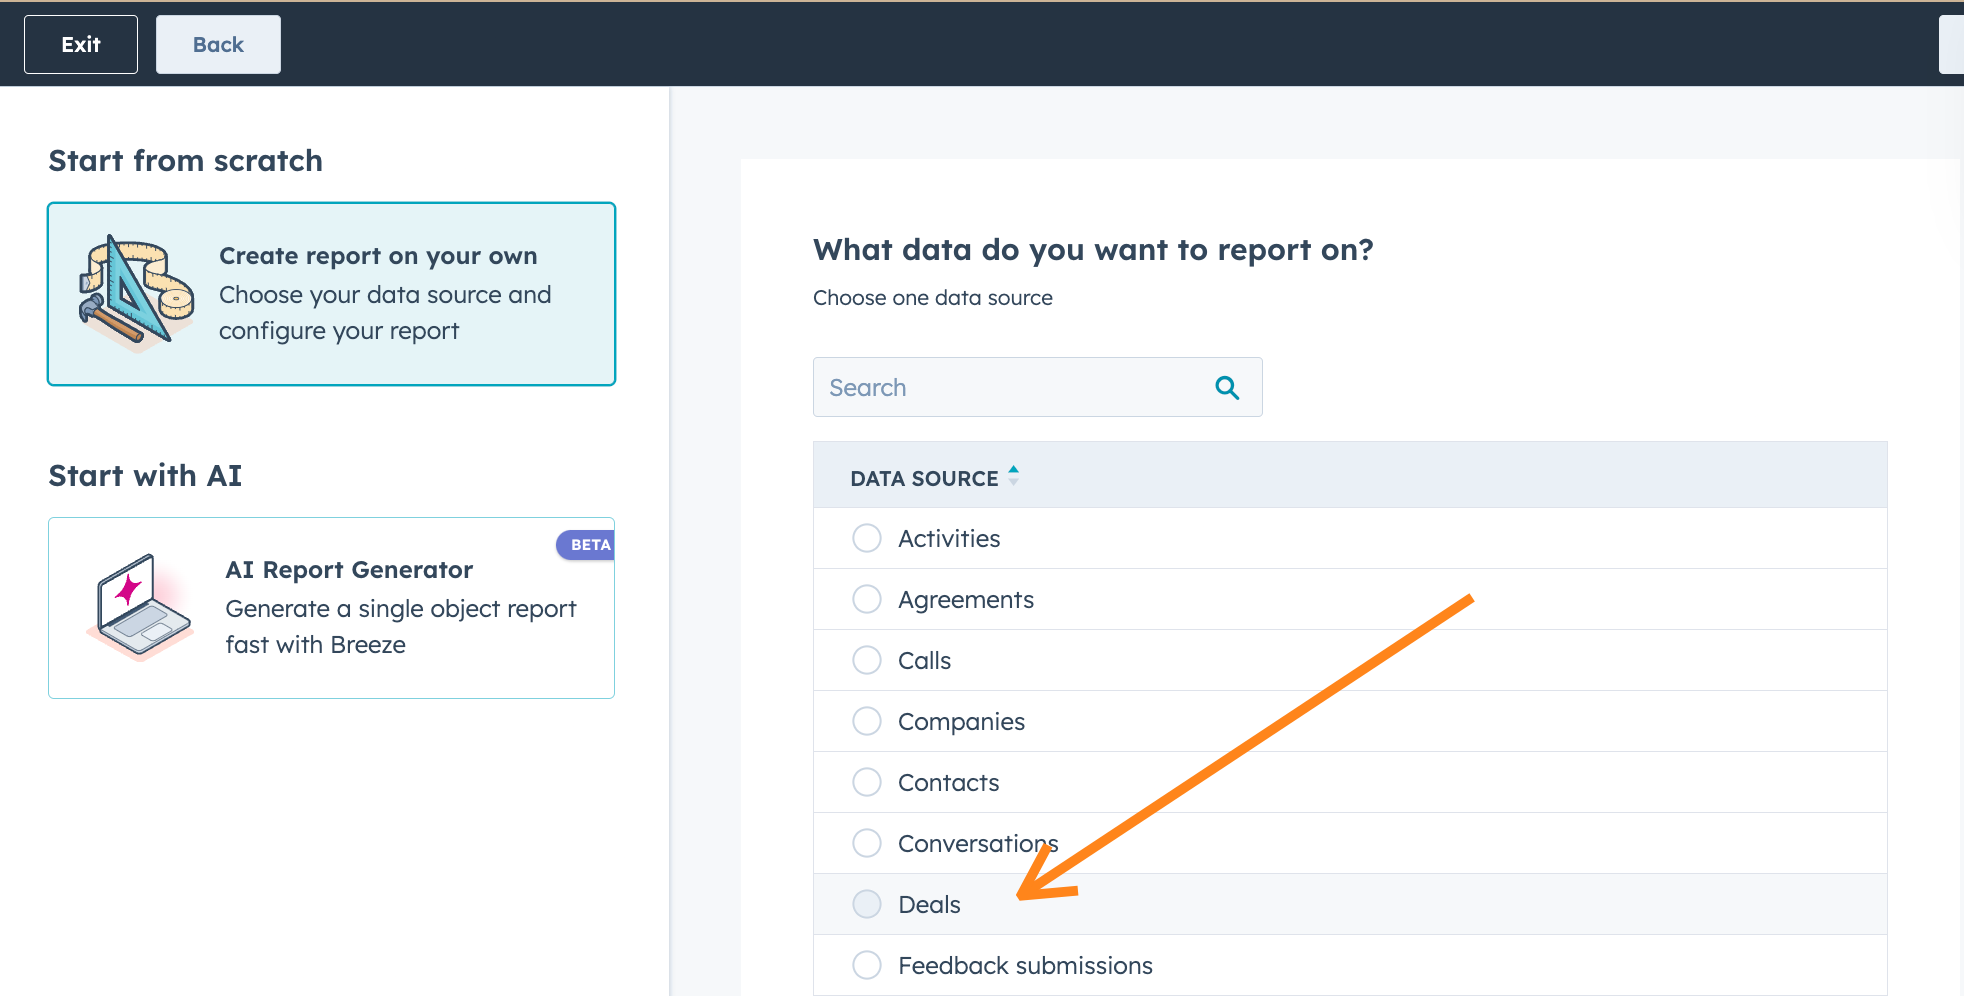
Create a new Single object report reporting on Deals.
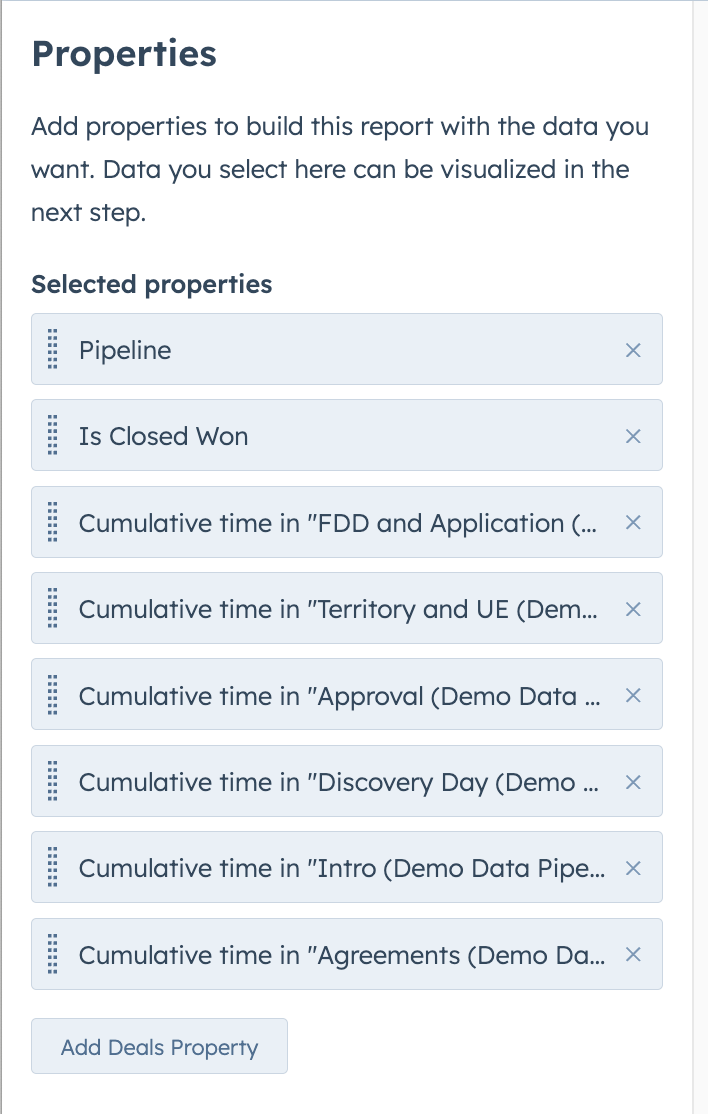
In the Data tab, set up the properties you’ll need: the Cumulative time properties for your Open Deal Stages, pipeline, and the Is Closed Won property.
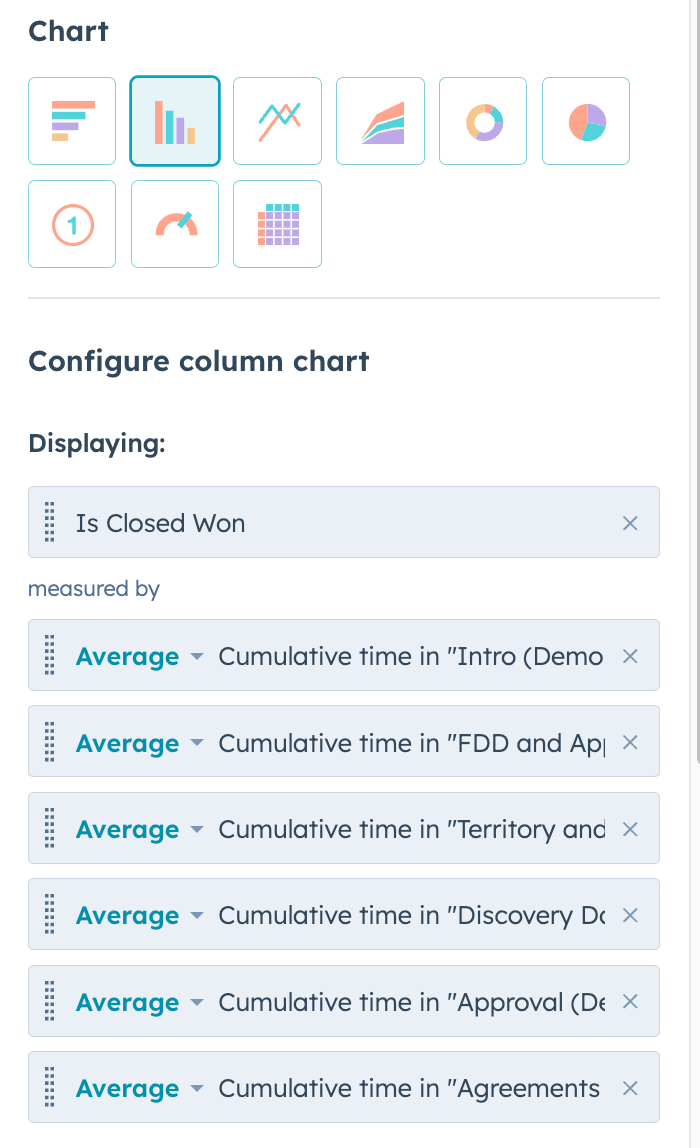
Set up the Visualization tab: select horizontal bar and add Is Closed Won measured by the Cumulative time properties.
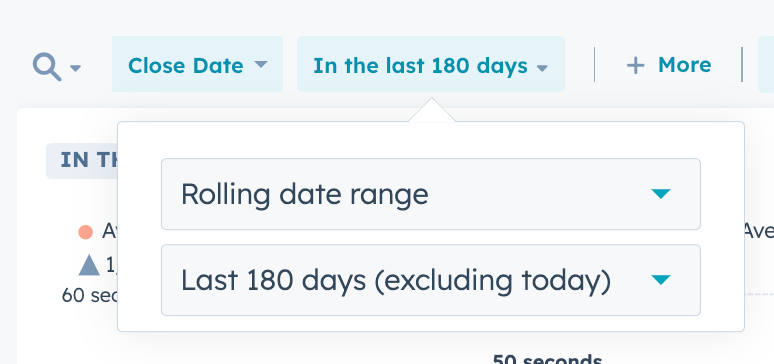
Set the report Date to Deals Closed in the Last 180 Days.
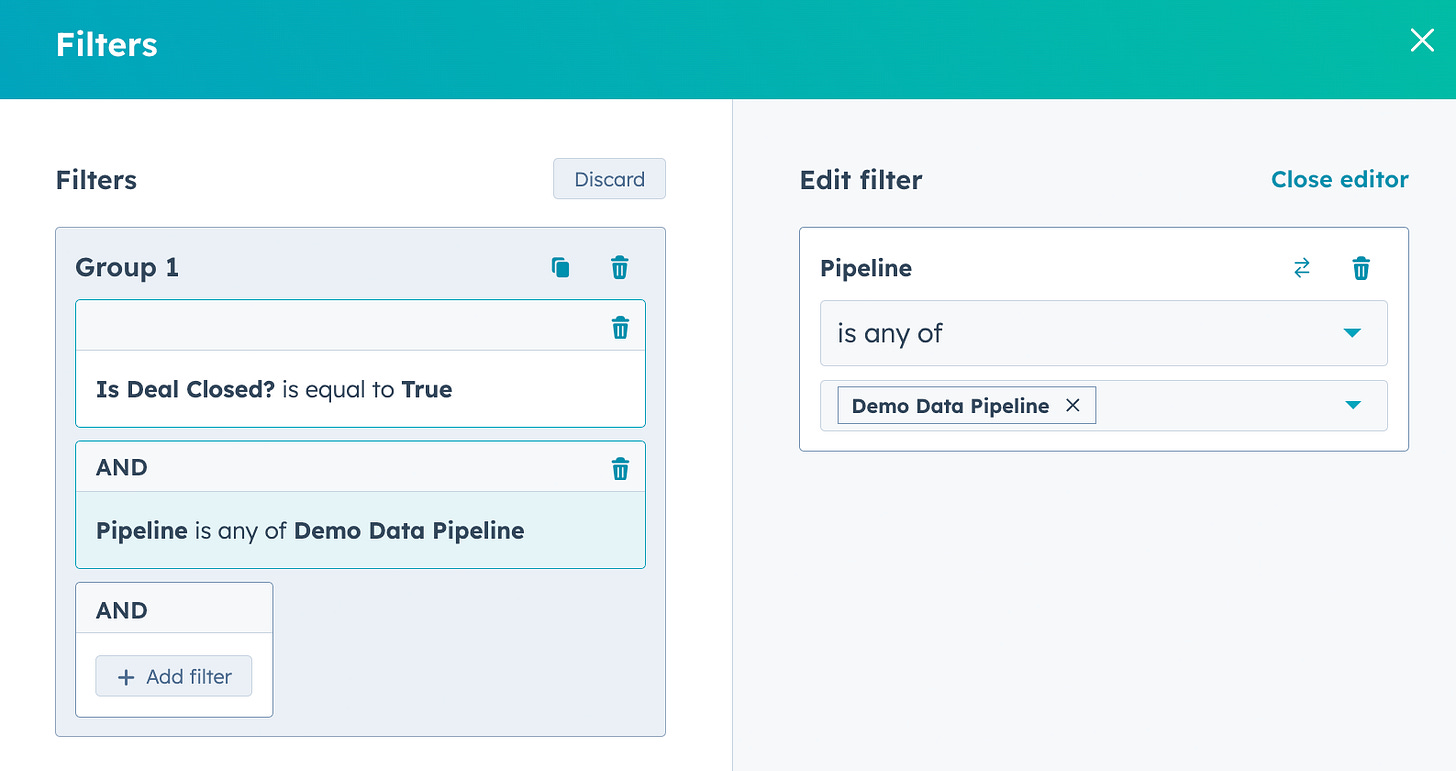
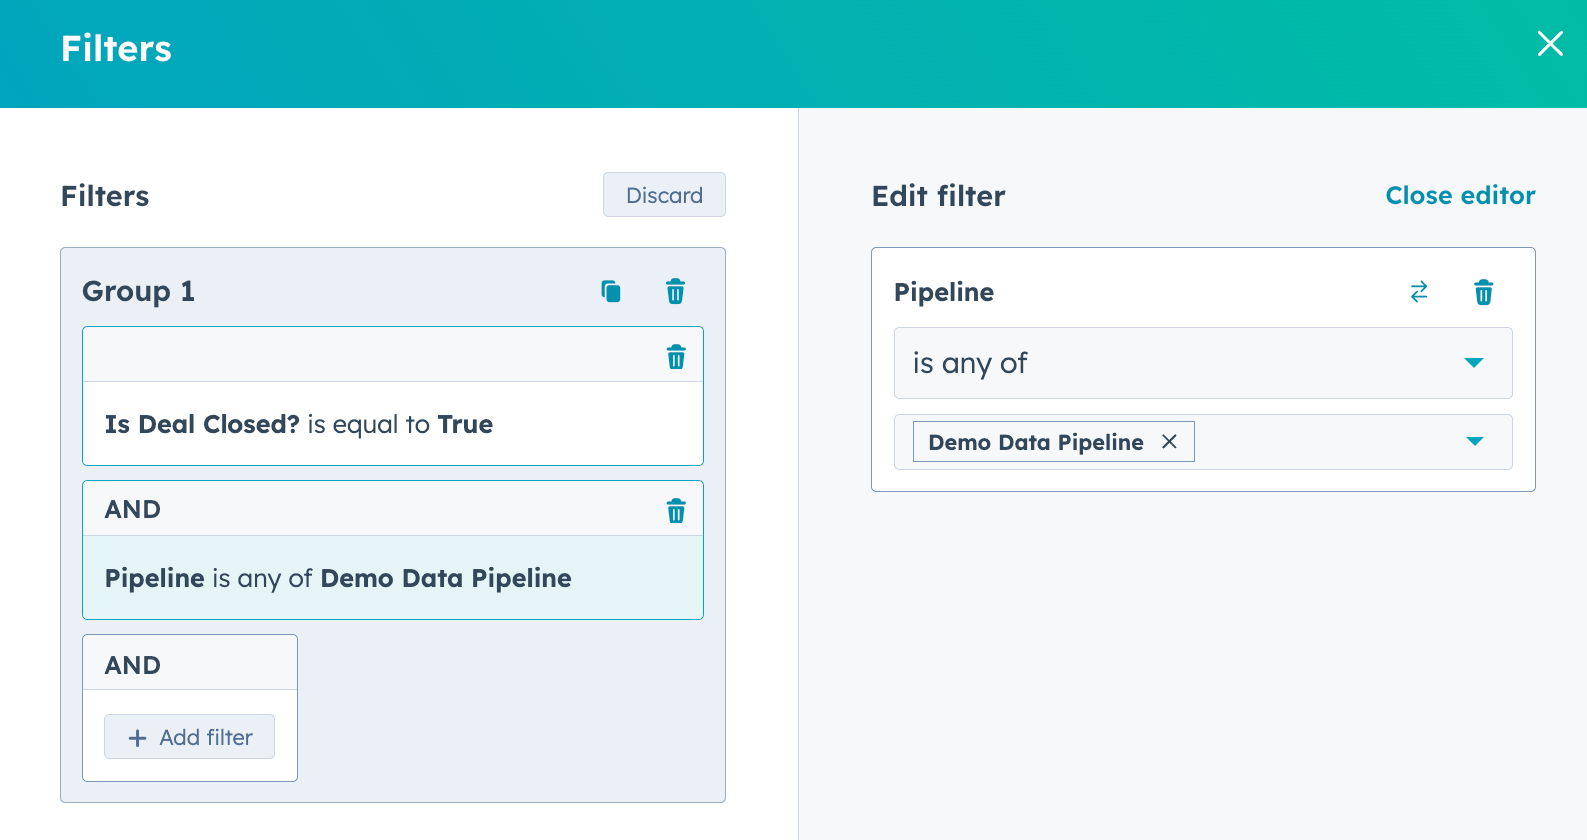
Set the Advanced filters to Closed Deals and select your Sales Pipeline.
Save and start finding bottlenecks in your FranDev!
Here’s the walkthrough:
Create a new Single object report on Deals.
In the Data tab, set up the properties you’ll need.
All the Cumulative time properties for your Open Deal Stages.
Pipeline
Is Closed Won
for extra credit add any other dimensions you may want to analyze by: Owner, Source, etc.
Set up the Visualization tab.
Select horizontal bar.
Add Is Closed Won
Measured by your Cumulative time properties
Put the Cumulative time properties in the order they appear in your pipeline
Set the report Date to Deals Closed in the Last 180 Days.
Set the Advanced filters to include Closed Deals and select your Sales Pipeline.
Save and start finding bottlenecks in your FranDev!


So…now what?
Find the highest bar the furthest in your Franchise Sales Pipeline and tackle it!
Step 1: Find your highest, furthest bottleneck
In our example above, I said sirens and alarm bells should be going off if a Deal has been in Agreements for 2 weeks.
Step 2: Get some visibility on it
Where’s the bottleneck in your sales pipeline? Do you have sirens and alarm bells when a Deal has been there too long?
Do you have notifications, Deal Tags, and Reports surfacing Deals at risk? Or do you just figure the Reps are keeping an eye on things?
Step 3: Investigate what’s going on
In the example, Leads are attending Discovery Day, getting approved, legal is putting together the signing packages and then they’re sitting there for a month before being Lost. What’s going on?
What are we missing earlier in the pipeline? Are we not getting legal review of the FDD or Franchise Agreement until the very end of the process?
Drill down on those Closed Lost Deals. What is causing the delays? What do the notes say? What are the Closed Lost Category and Descriptions? What are you missing?
Step 4: What are you going to do about it?
Is this a process problem? An expectations problem? A communication problem? Can automation help?
I’m always here to help if you’re having trouble.
See you in the next Lab Report.
Which of these future topics are you most interested in?
Reply and let me know. Frequently requested topics get covered sooner.
Automatically enrolling No Shows in re-booking Sequences
Create meeting booking forms/links for your Meeting Types
Building a Franchise Application process in HubSpot