

Create a Mini-Dashboard About Each Broker
HubSpot can help you see all of a Broker's current and past leads.

In this Lab Report:
When a broker calls asking "How are my leads doing?” you shouldn’t panic or dance, trying to remember who is who. HubSpot can keep that associated with the Broker for you and give you a go-to “mini-Dashboard” about the Broker’s current and past leads. Let’s make HubSpot work better for you.
Why This Matters
Knowing your brokers is as important as knowing your leads and your numbers. You might know the Brokers you’re working with right now, but…
When a Broker calls and asks “How are my leads?” do you panic a little? Or can you call this up in HubSpot in seconds?
You always remember Brokers who have brought you Leads that you win. But do you remember how many leads they’ve brought? And how many you’ve won? For all the Brokers you work with?
You know who your repeat Brokers are, but do you know which Brokers have the best win rate?
You need a single place where you can see an individual Broker’s past outcomes and current activity. A mini-dashboard on the Contact Record for the Broker, if you will. Let’s look at how to do that.
Here’s how you can eliminate that panic…
You should be relying on HubSpot to store this kind of information so you can focus on the relationship with Brokers (and Leads, of course). There’s a lot that I could drill down on here, but I’m going to give you 4 things you can do to make your Broker Contact records in HubSpot a useful mini-dashboard
But first, where to put them.
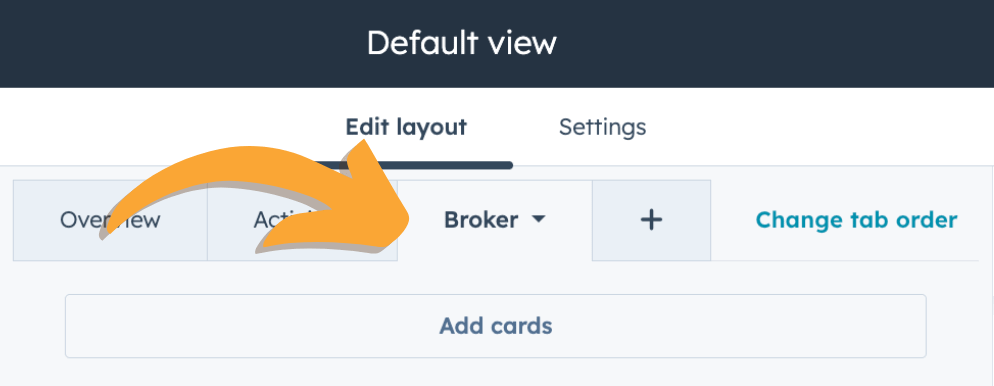
Create a Broker center column tab on your Contact Record views. Settings → Contacts → Record Customization → choose your view (probably Sales).
Adding this Tab to the Contact view for your team let’s you put all the Broker-related data in once place so its findable fast and isn’t mixed in with the cards you use when looking at Lead or Franchisee Data.
Add a Statistics card with info about current Deals
This answers the question “What’s going on with this Broker’s Leads right now?”
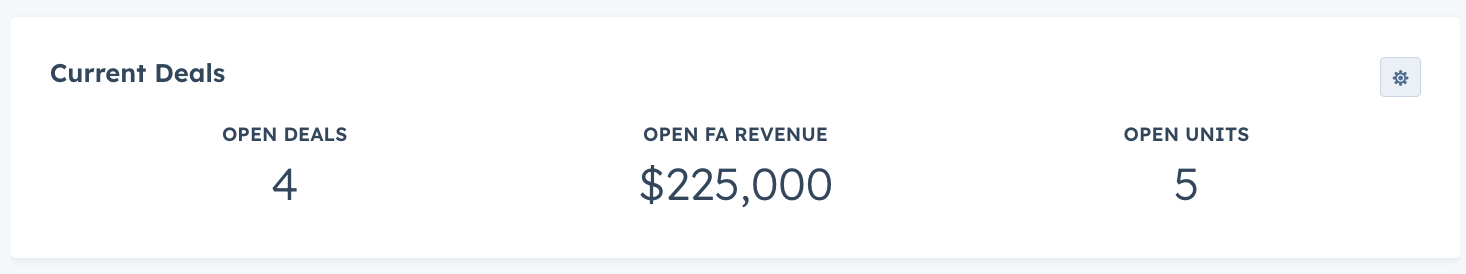
This is a Statistics card.
You can use this card to calculate values for Deals the Contact is associated with. It works well for information about open Deals. When a Broker calls and asks “how are my Leads doing?” this is where you look first—how many leads are open right now?
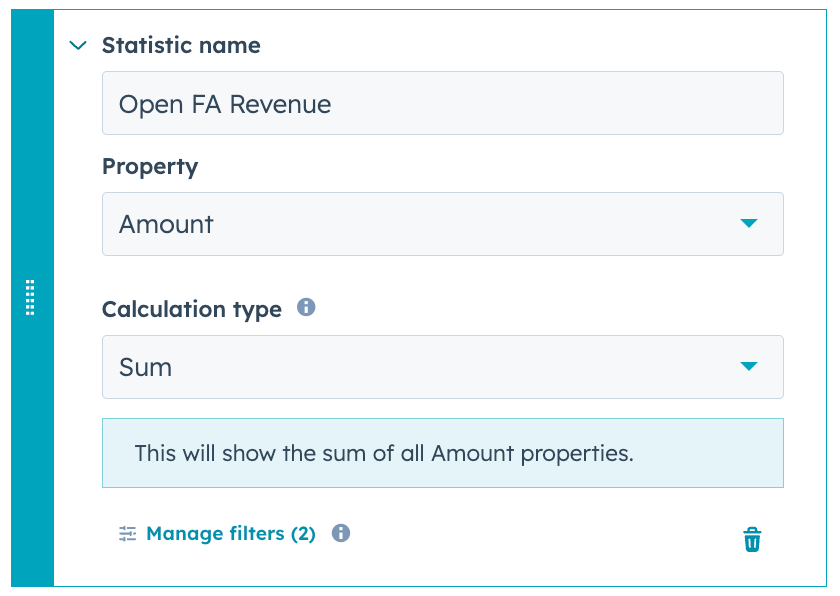
Here’s a look at the configuration of the Open FA Revenue statistic and filter. Follow this pattern for any others you want to add.
Add a Report with a pie chart of their Won/Lost Deals
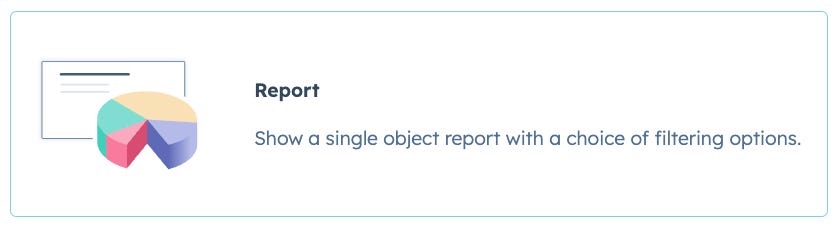
This is a really cool feature: you can add a Single object report to the center column of a record using a “Report card” (silly name, I know. That’s what it’s called).
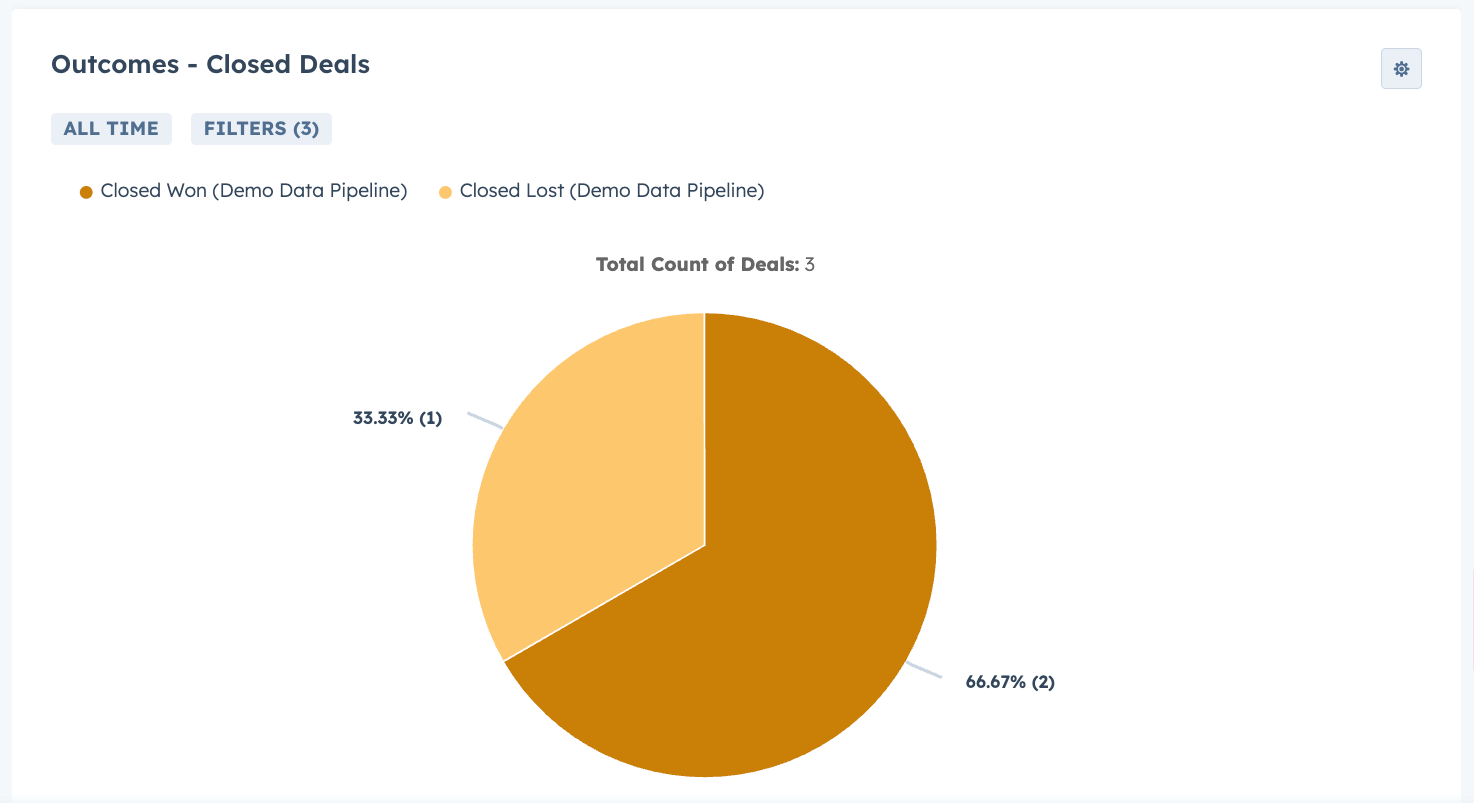
This report is a great visualization of what the longer term performance of the Broker’s Leads looks like. We include only Closed Deals (eg not Leads in progress) so we have a better picture of how Leads performed in the past.
You create this in the normal reports area: Reporting Menu → Reports.
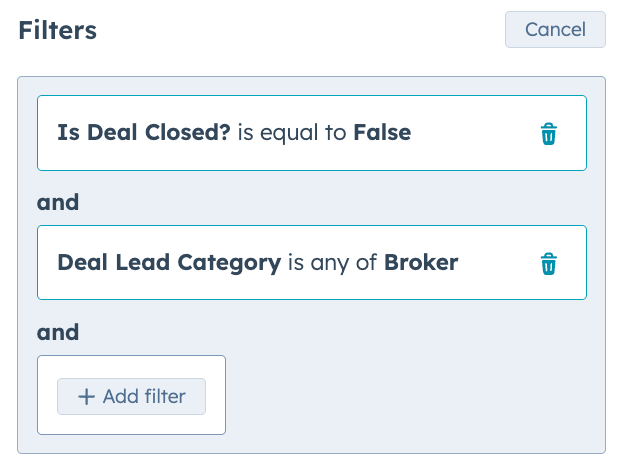
The report above includes:
Deals with a Close Date of All time
Is deal Closed is TRUE
Add a filter for your pipelines if needed
The visualization is:
Deal Stage by Count of Deals
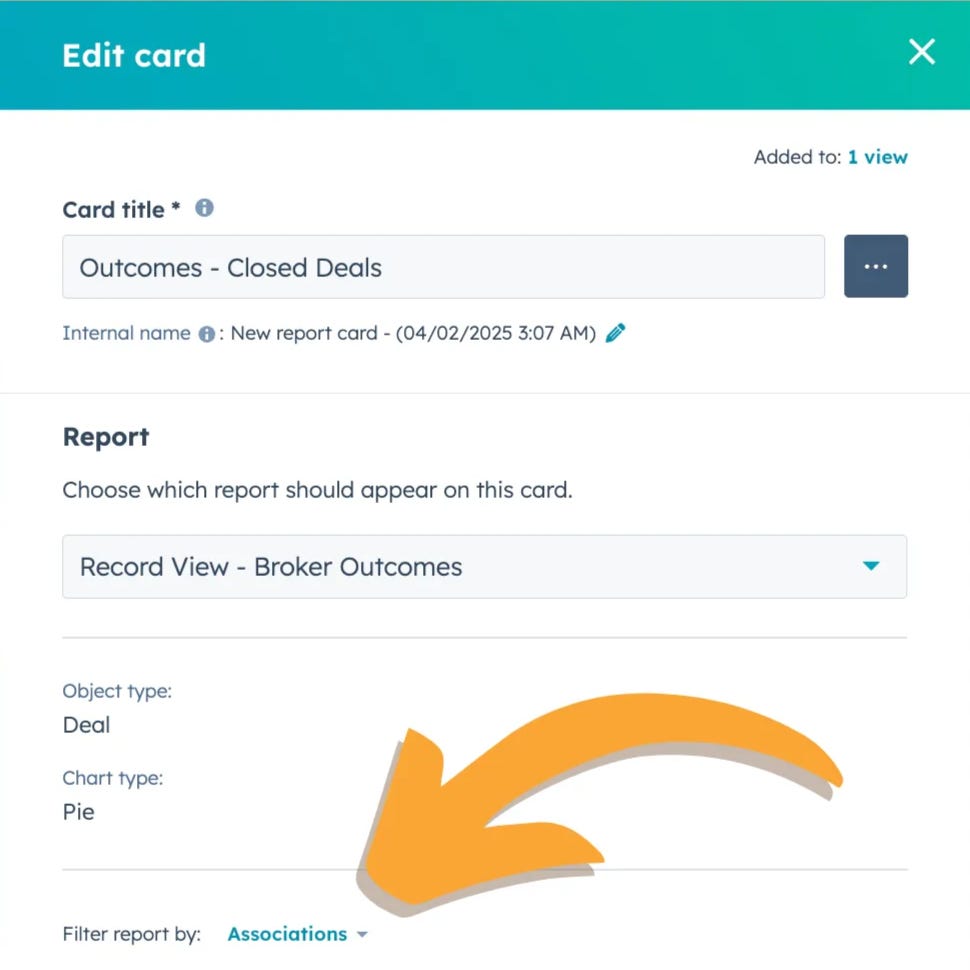
Once you have the report, create the card:
Choose your report and—here’s where you really need to pay attention—select Associations in the Filter report by: option.
Add a Card with Rollup Property Metrics
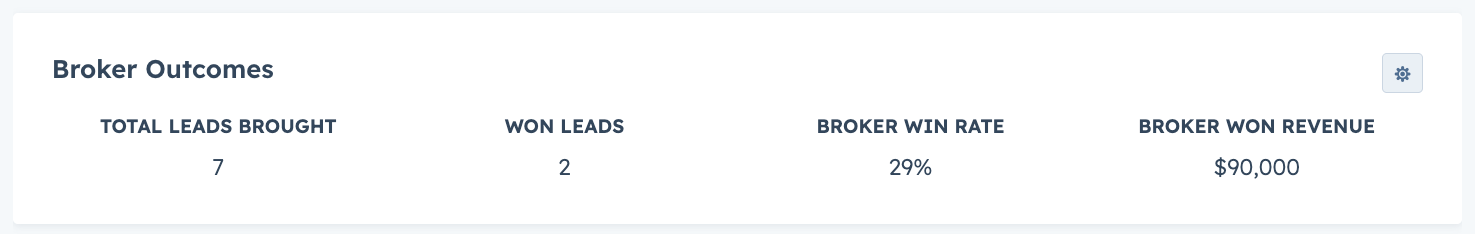
In the FranDev Lab, I create Rollup Properties on Contacts that use the Deals they bring to show outcomes. A few of these are redundant to the reports we looked at, but creating them as Rollup Properties means they also be used in lists and reports.
👉 For example, you could make a list of your top Brokers by Won Leads or Revenue if you wanted to invite them to an invite or send a thank you note.
To do this one, you’ll need to create those Rollup Properties (which is more than we can get into here) using an Association Label between the Broker and the Deal. Reply or message me and I’d be happy to talk through this with you.
Add a Report with their Open Deals by Stage
This one also uses the Report card. It answer your Broker’s question when they ask “where are my Leads at right now?” You get a quick overview of where their open Deals are by Stage.
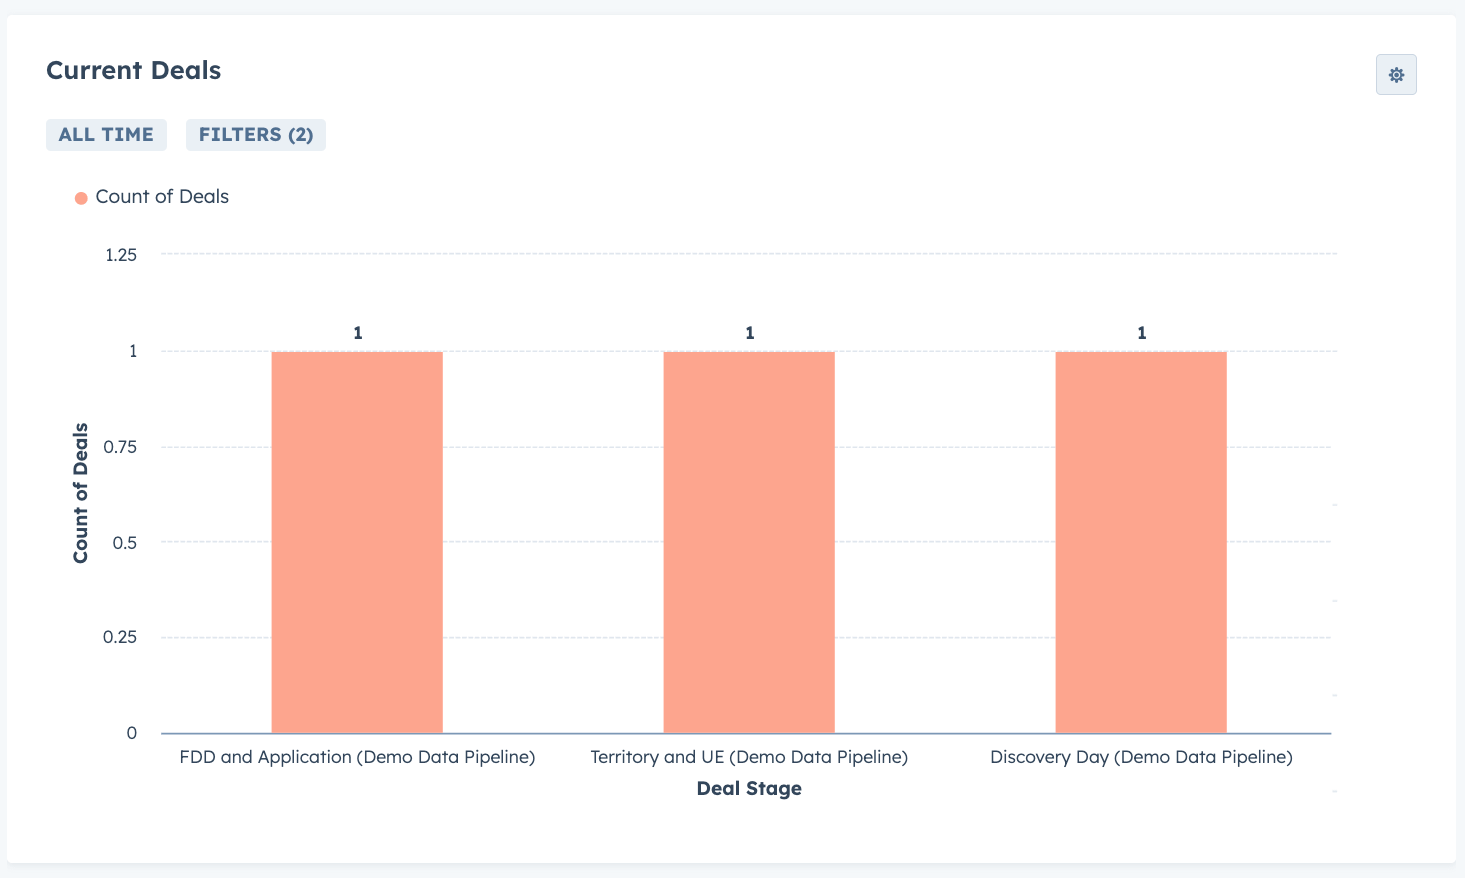
This Broker has 3 open Deals. One in FDD and Application, one in Territory and UE, one in Discovery Day.
Click on the column to see the detail.
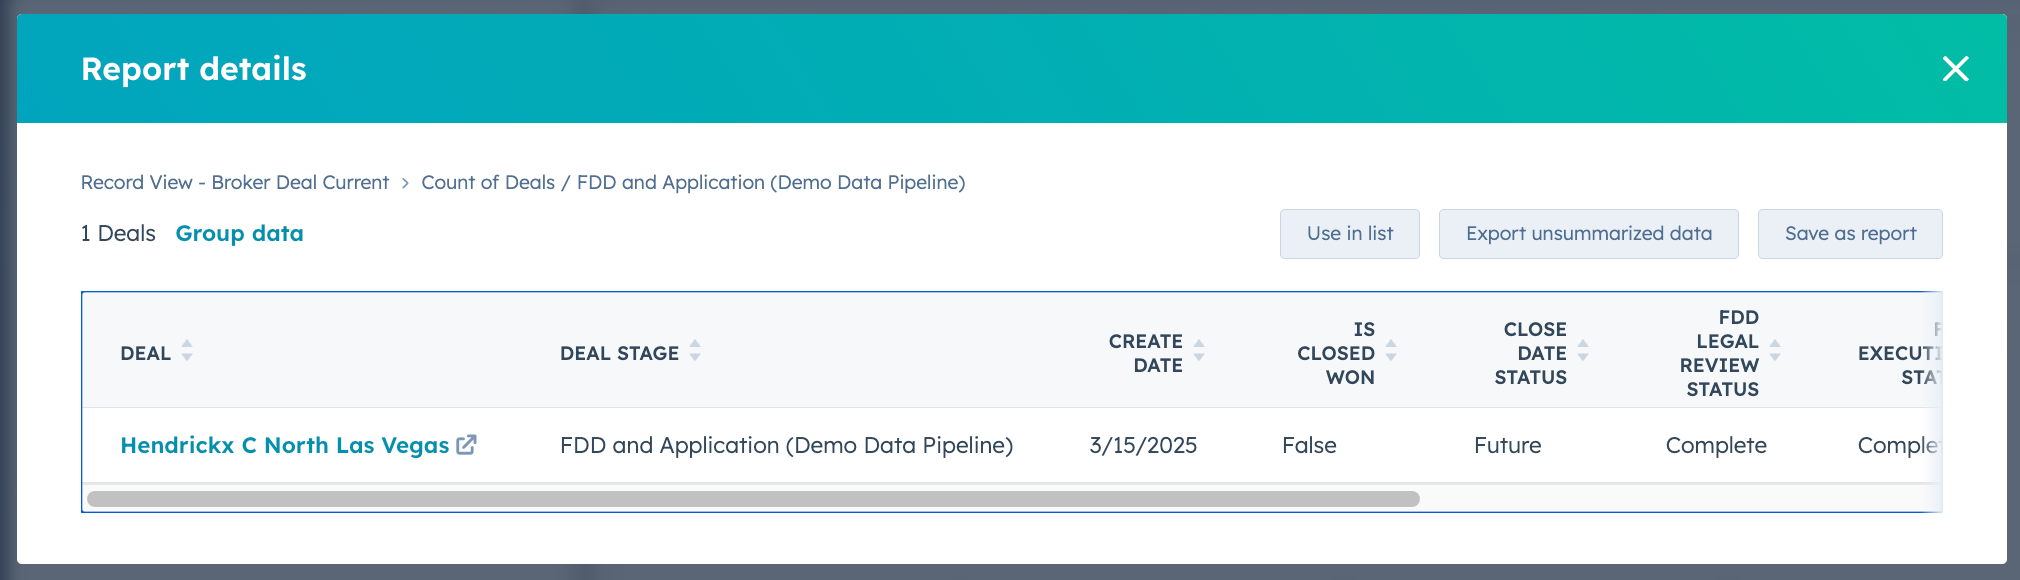
Set up the properties to surface what you need to know to give your Broker a good update. I use milestone statuses (FDD Signed, Territory Selected, etc.) If you need to get details or review your notes, you can click through to the Deal from there.
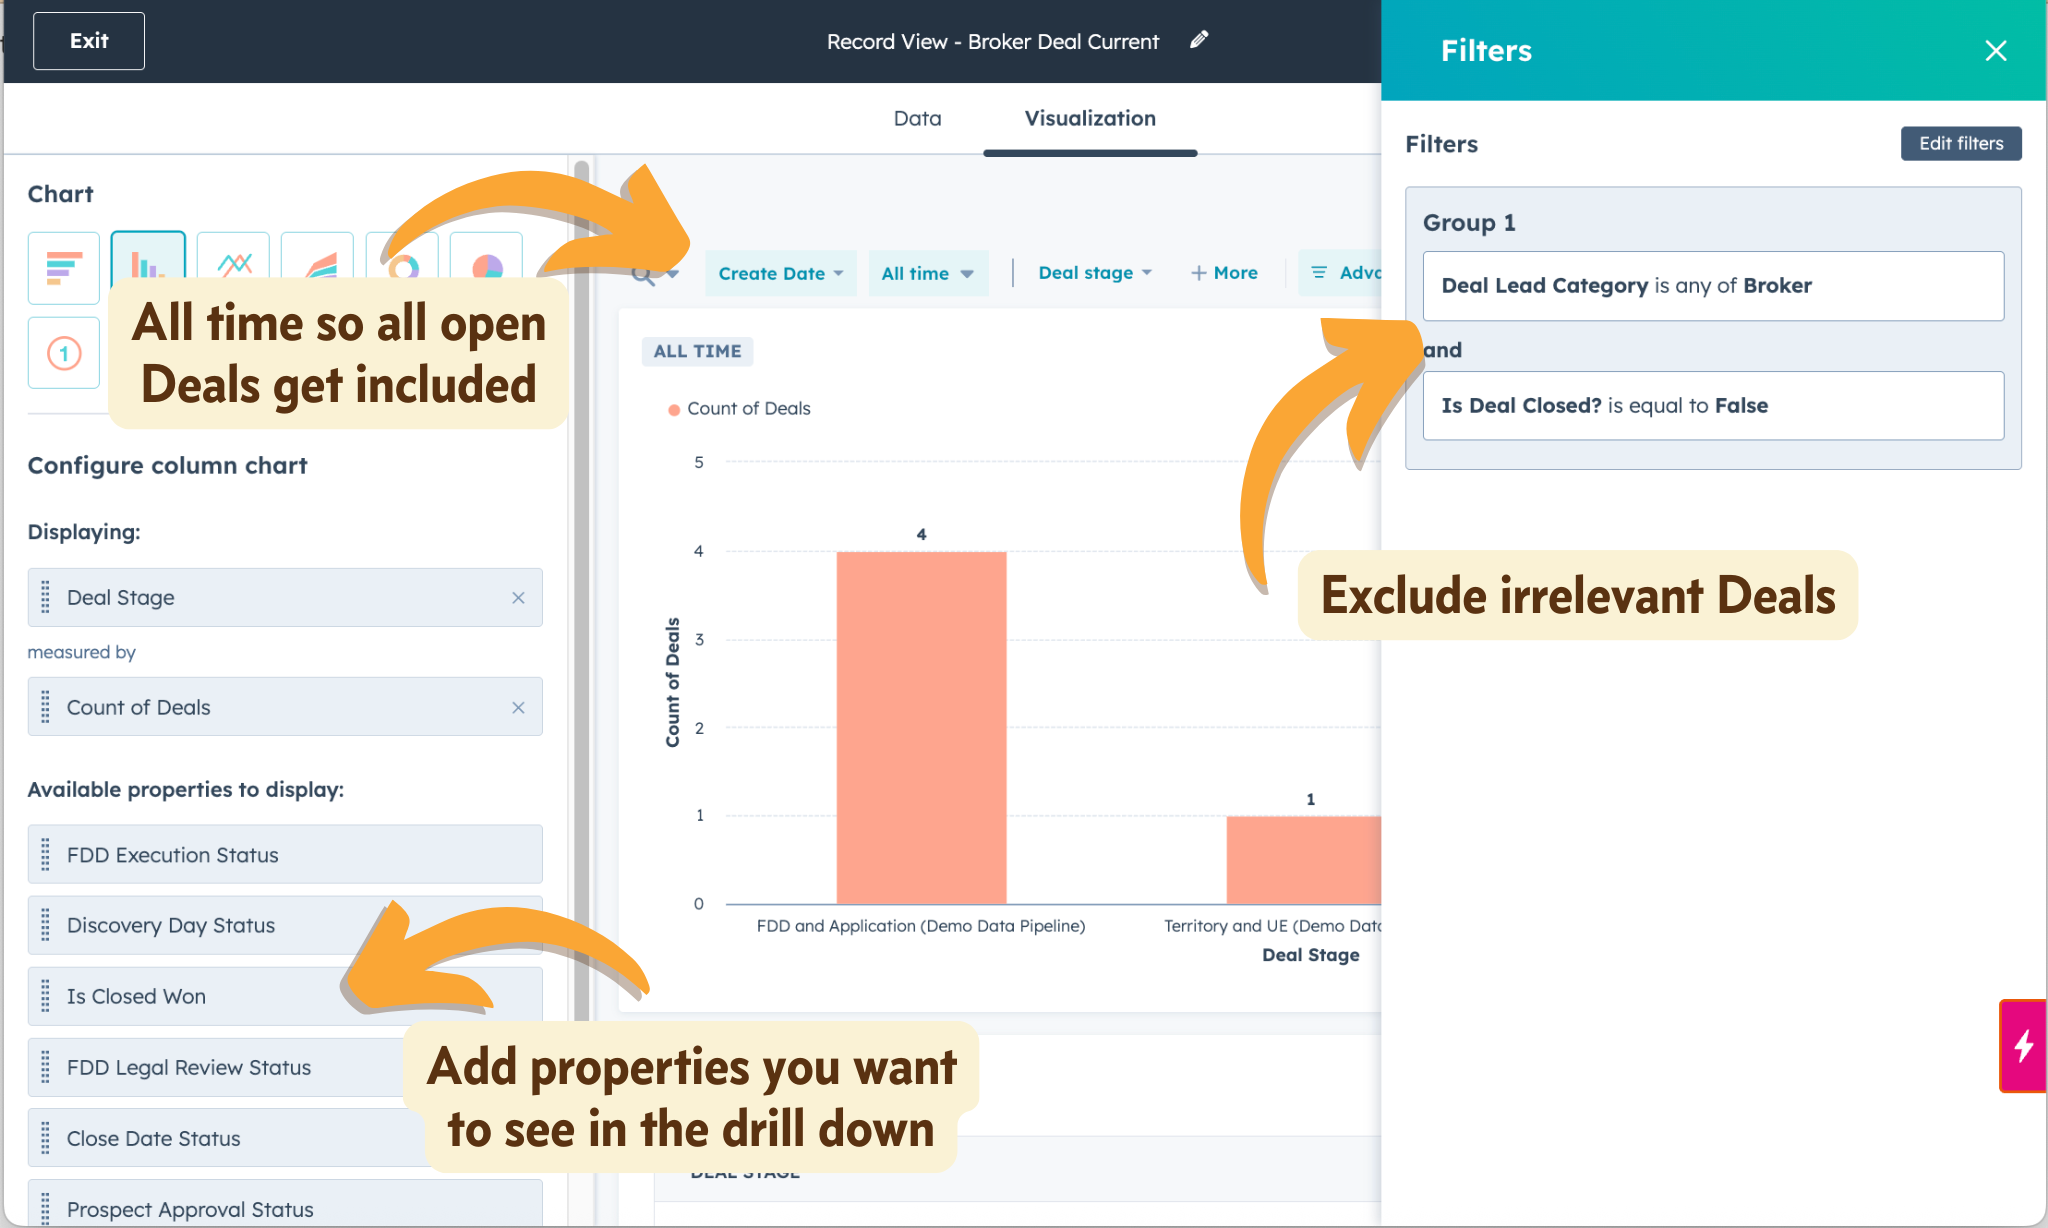
Here’s what that report build looks like:
See all their Deals
The Deals Association card in the right hand column lists all the Deals you have associated with the Broker. This is another way to quickly review the Leads associated with a Broker. Its not as fast as the mini-Dashboard for getting an overview, but it’s your fastest path to a specific Deal.
Remember to use an Association Label for the Broker Contact to Deal association!
So…now what?
You know what to do: go set this up!
See you in the next Lab Report.