

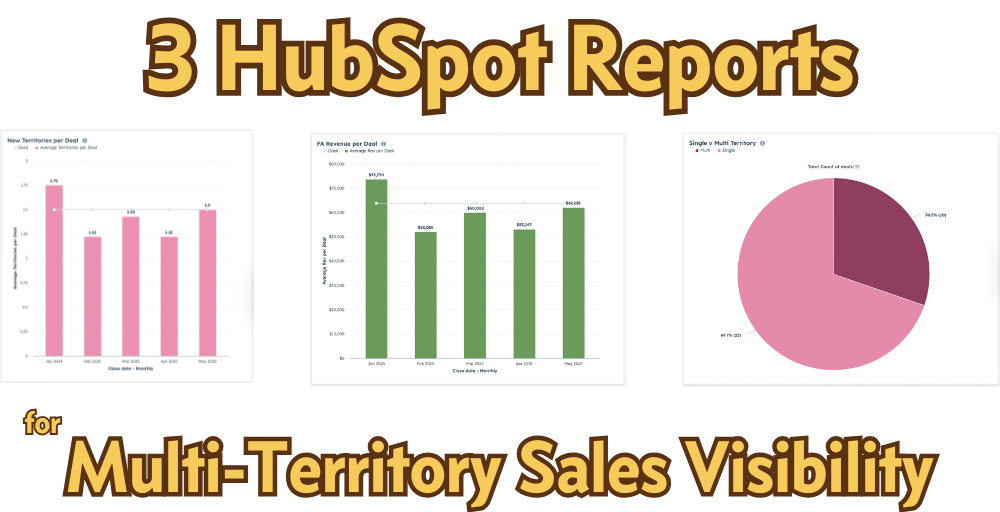
3 HubSpot Reports for Multi-Territory Sales Visibility
If you have goals for—or even just interest in—multi-territory sales, you need to see how it's going.

In this Lab Report:
Your growth goals include both new FA revenue and new territories so you need visibility into how your franchise sales are performing against those metrics. Fortunately, it’s simple calculate on Average Revenue per Deal, Average Territories per Deal, and share of Multi-Territory Deals in HubSpot (as long as you have the data).
Why this matters
You’ve set your targets for franchise growth. They include new territories sold and revenue from the franchise fees those territories will generate. If multi-territory ownership is part of your growth strategy, you may have a specific goal for territories per won Deal, but even if you don’t have an explicit goal, you have one that you can calculate: FA Revenue Goal / Territory Goal.
Either way, you need visibility into how you’re doing to see what is happening in your franchise sales pipeline, so let’s get you that visibility.
Let’s Look at the Reports
Franchise Fee Revenue Per Deal
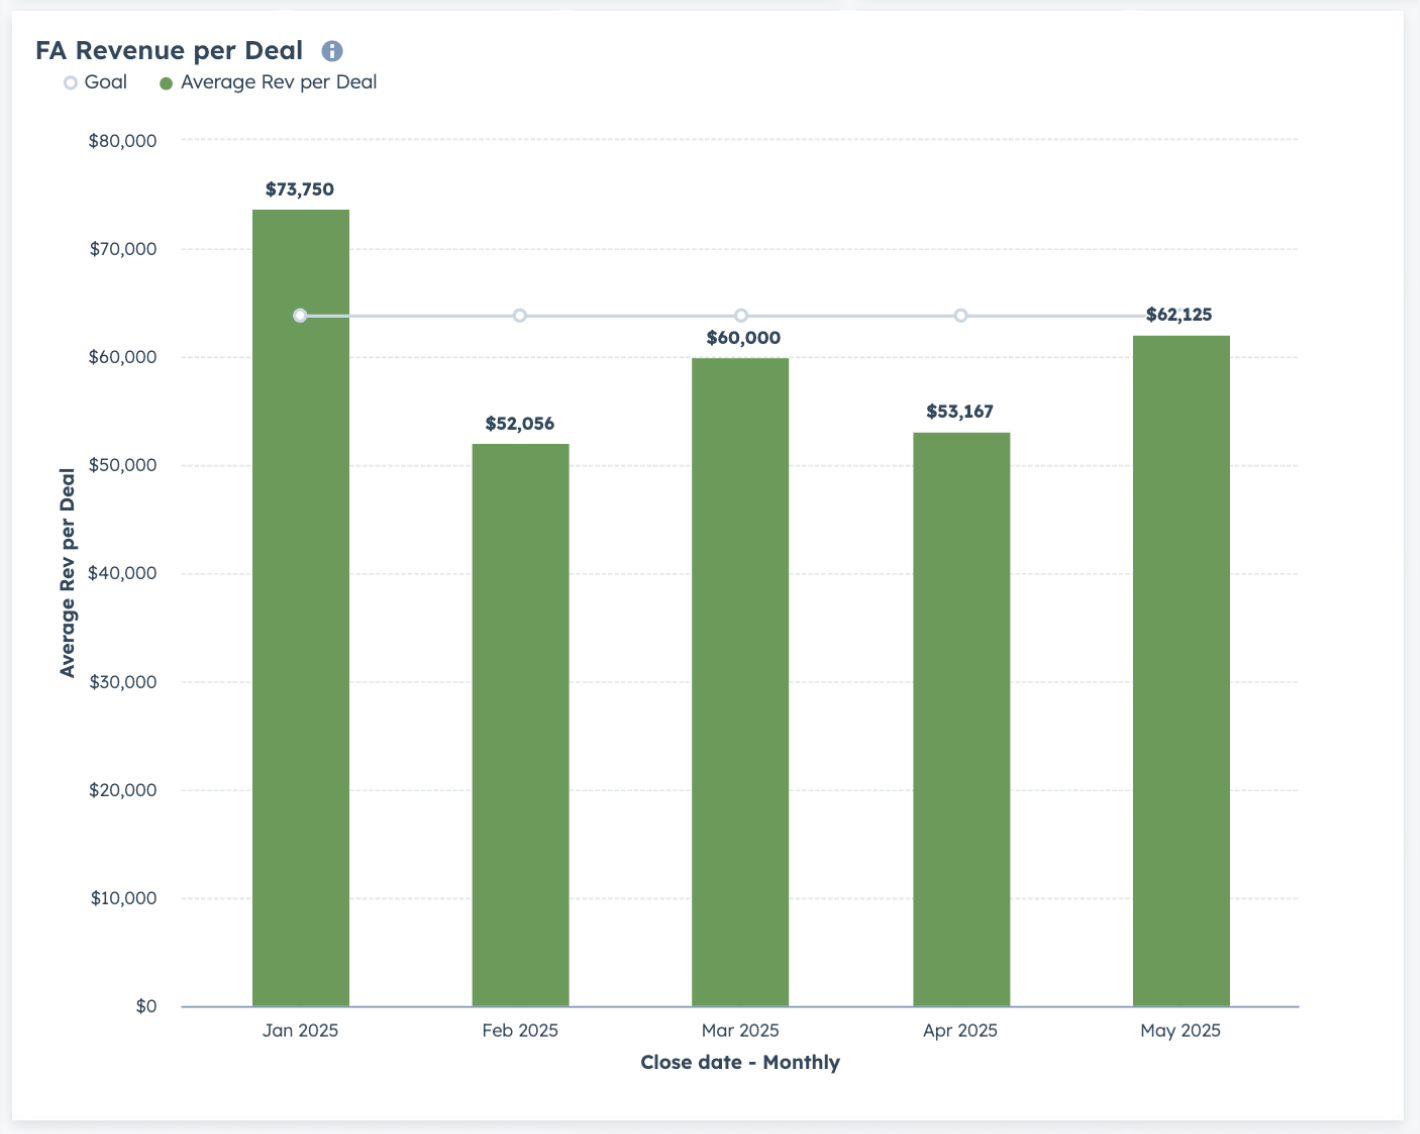
This view of your per-Deal revenue is a good efficiency metric overall: if you’re not hitting your Total FA Fee revenue goal but are hitting your territories and won Deals targets, this is the first report you should check.
It’s an easy report to build and should be on your Executive Dashboard:
Its a simple average aggregation of the Amount of Closed Won Deals (in the config below, the label is updated to “Average Rev per Deal”)
By Close Date to see it over time
Add your Goal in Chart Settings
Add filters for your pipeline and Closed Won Deals
Here’s what the configuration looks like:
This one is also useful if your FA Fees are variable—for concepts that base the fee on households in the service area, for example.
New Territories Per Deal
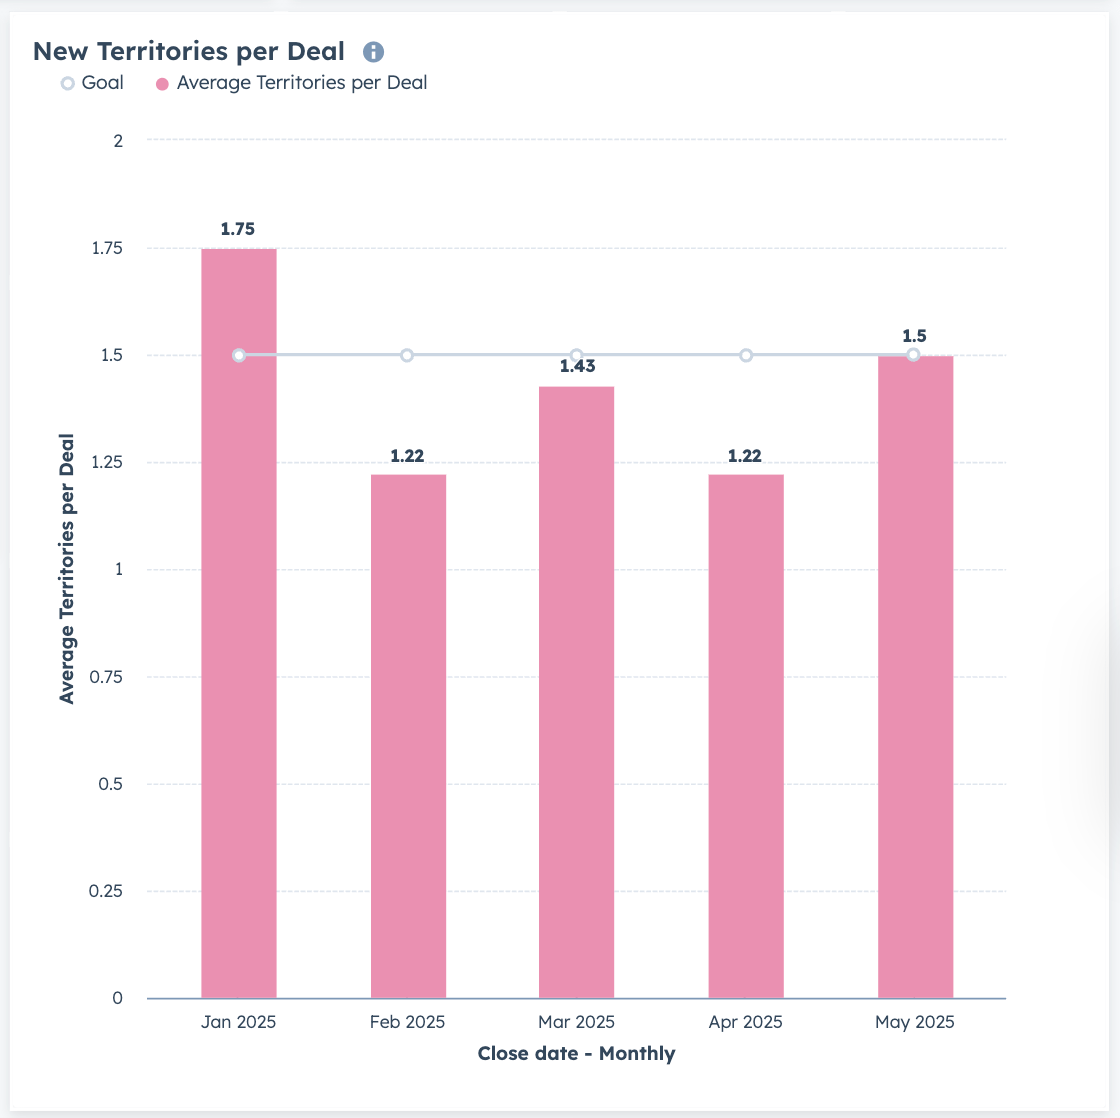
This report gets to the heart of your multi-territory sales performance against your goals—whether those goals are set explicitly or are just calculated from your top line targets.
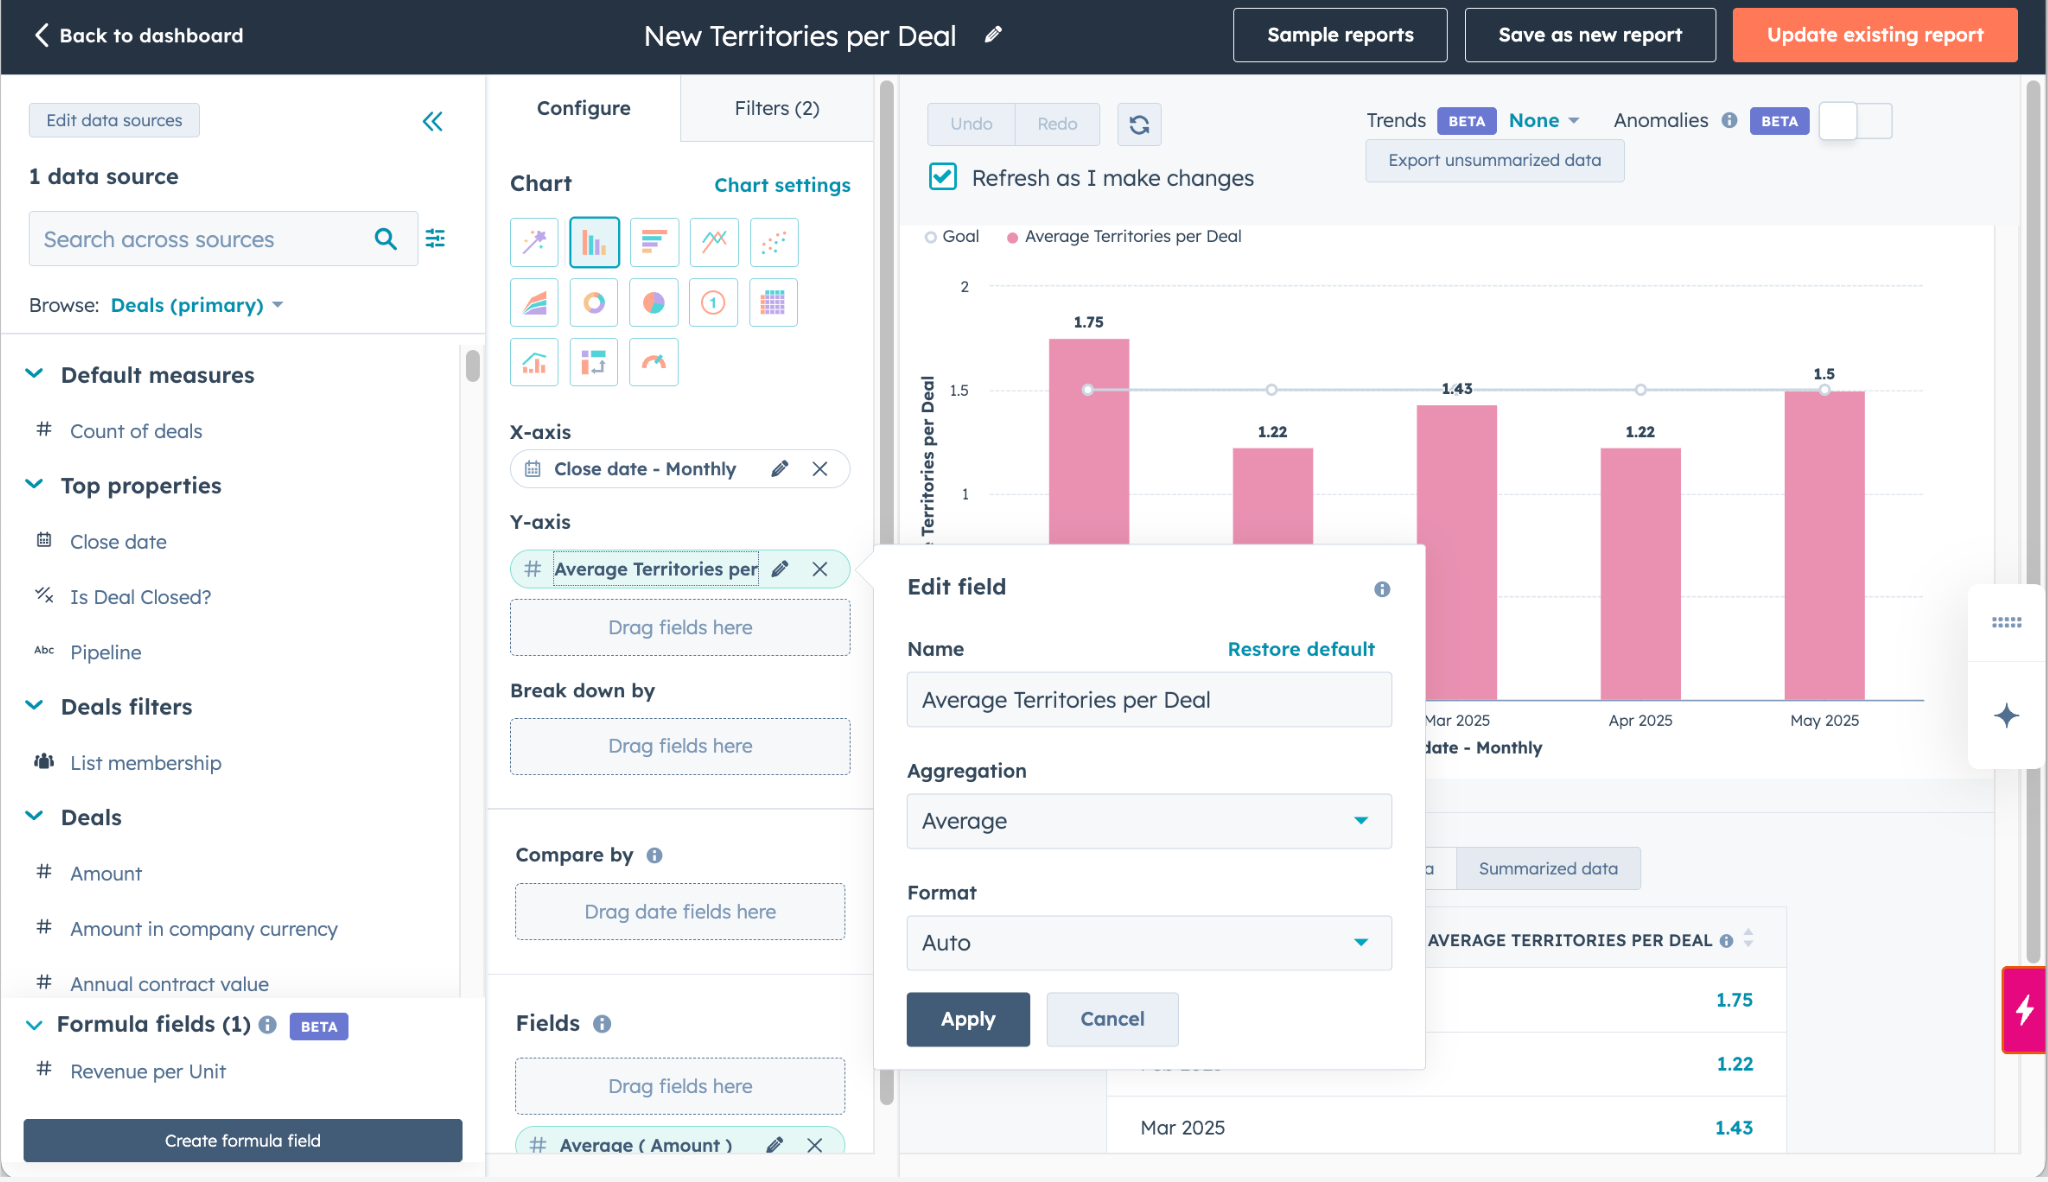
It’s also a simple report to build, but you need to be tracking the count of territories on your Deals:
An average aggregation of the number of Territories in Won Deals (in the config below, the label is updated to “Average Territories per Deal”)
By Close Date to see it over time
Add your Goal in Chart Settings
Add filters for your pipeline and Closed Won Deals
Later this month in video playbook for paid subscribers I’ll drill down on tracking count of territories on your Deals.
Here’s what that config would look like:
This is how the report would look for a Franchise with geographic or fixed territories. If you use household- or population-based territories, you may want to substitute or also report on households or population per Deal.
Single v Multi Territory Deals
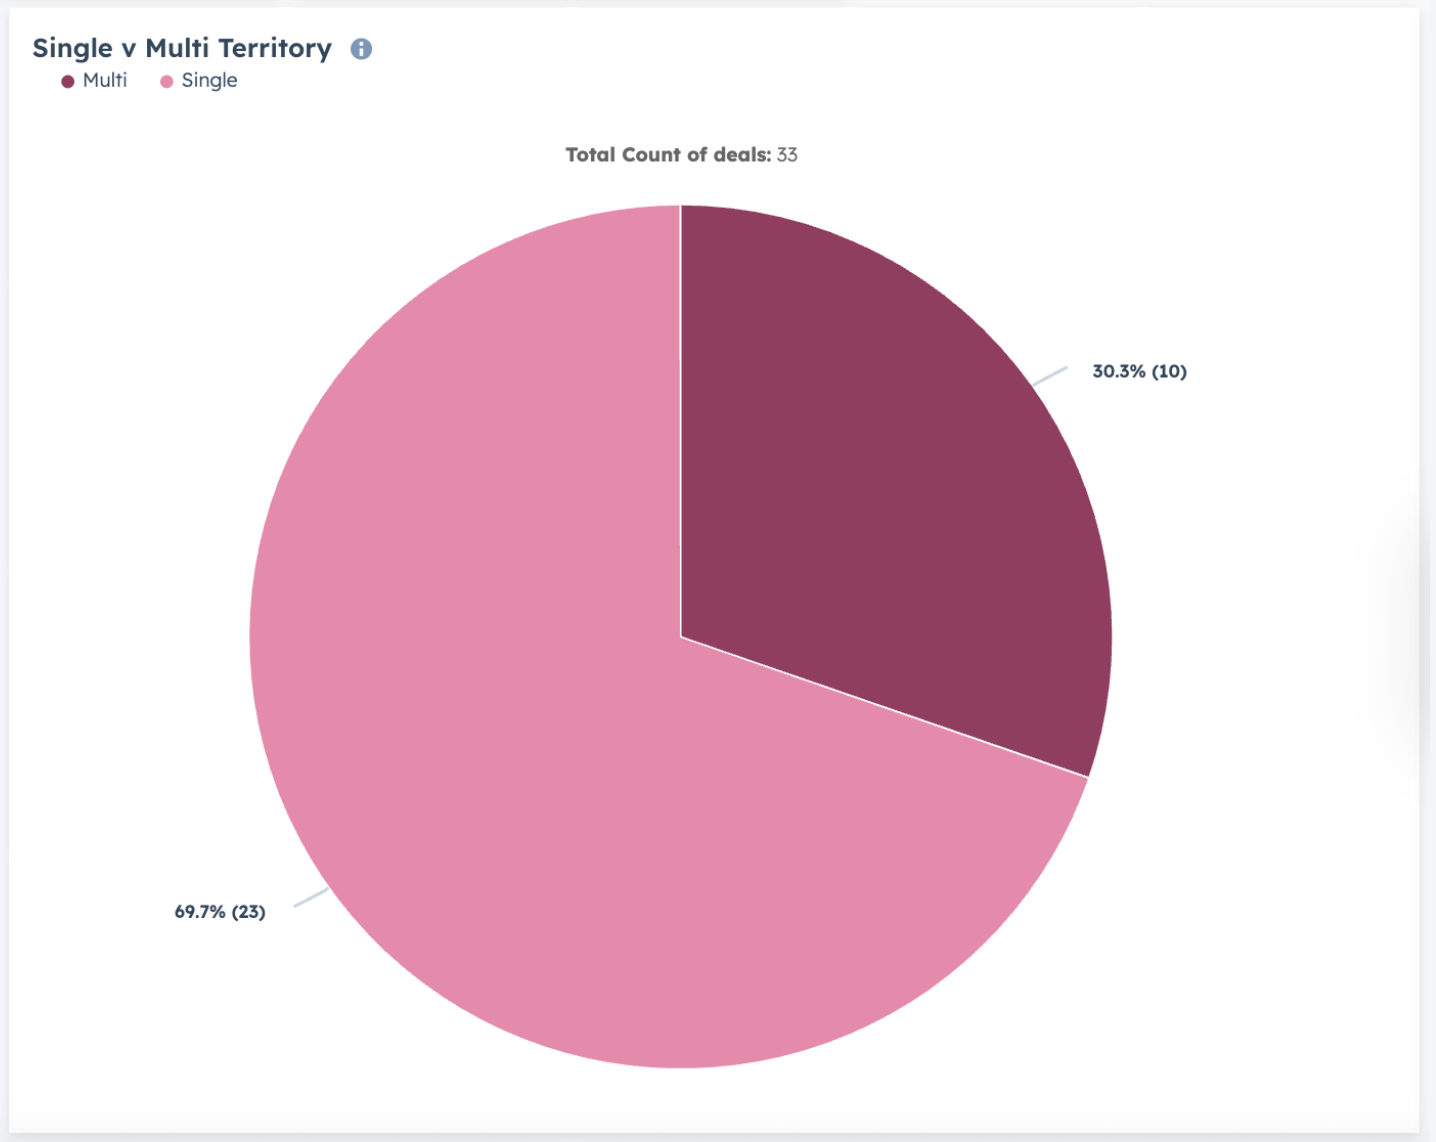
This Report gives you a quick visual representation of the percentage of Closed Won Deals that are a single territory vs multi-territory, using the same number of territories property you would use for the report above.
There are couple of ways to build this report. If you’re doing it the hard way (but why would you?) you would need to capture whether a Deal is Single- or Multi-Territory in addition to the number property. What. A. Pain.
The best way is to opt into the Formula Fields now in Custom Report Builder Beta (from September 2023…it works great. Why its still in Beta, I don’t know.) and have an Ops Hub Enterprise subscription (to get spreadsheet-style Formulas in the builder). You get the visibility without a bunch of extra properties and the work setting them and keeping them in sync.
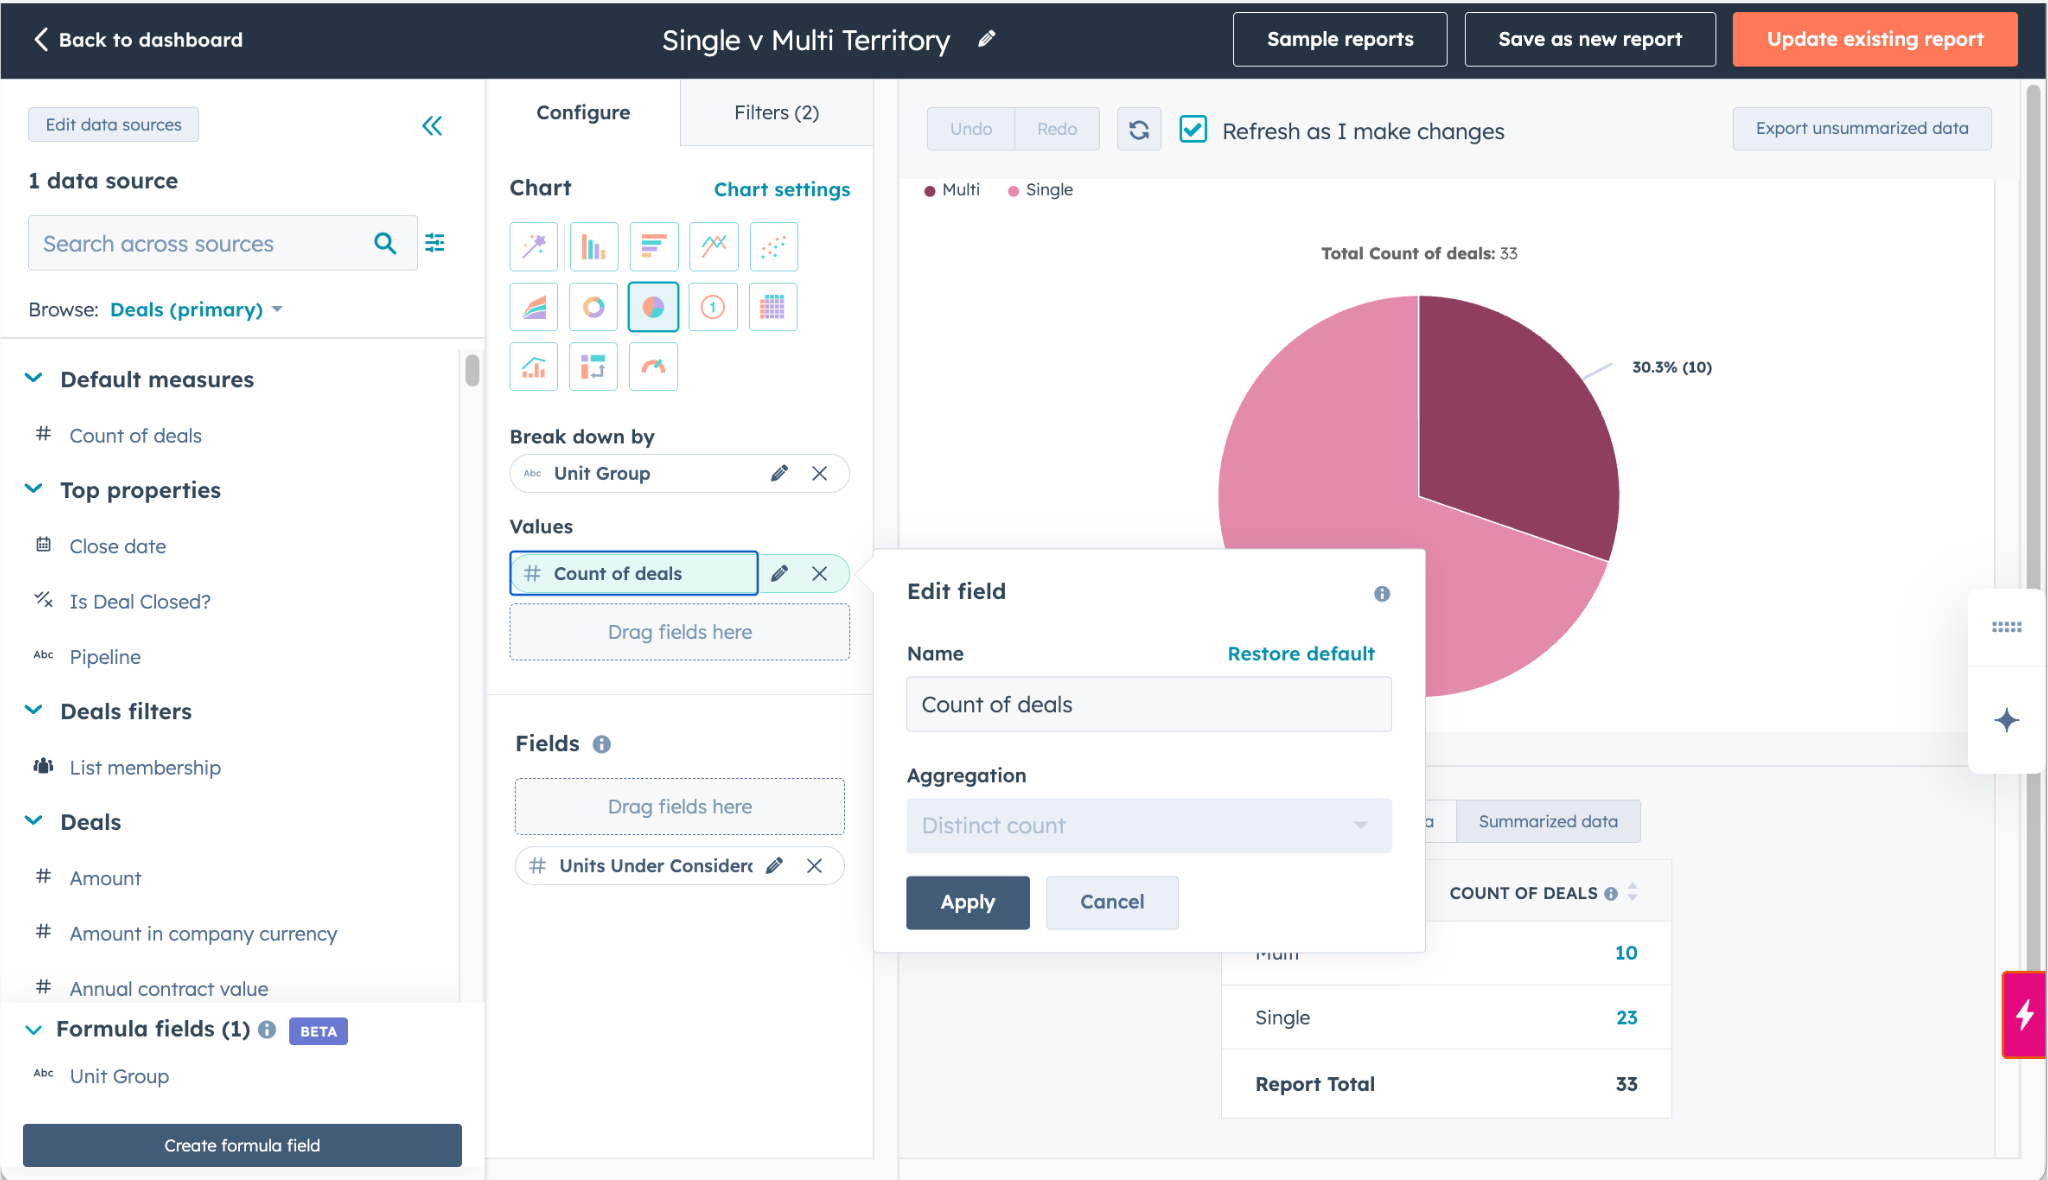
Count of Deals
Create your formula field (called Unit Group in the config below)
Of course, add filters for your pipeline and Closed Won Deals
Here’s the config:
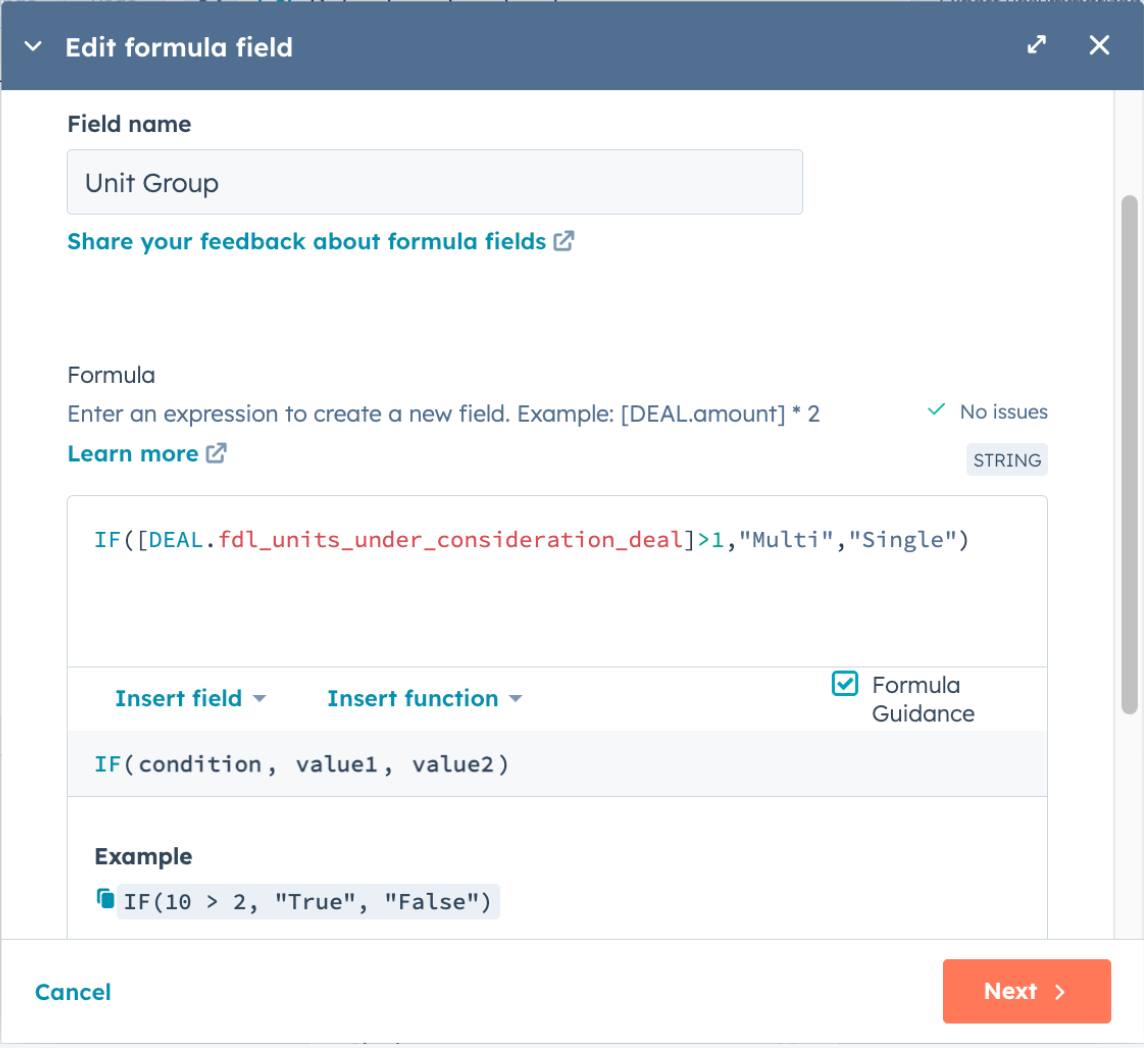
And here’s how the formula looks:
If you want to know how you’re trending, make a copy of this report, flip it to bar chart by Close Date like the other reports I covered here.
So…now what?
The first two reports are easy to create with any Pro subscription, so go get creating.
If you have Ops Enterprise, opt into that beta and create the third.
Then use your newfound visibility to analyze your multi-territory performance against your goals:
If you’re not where you want to be, it is FA Fee revenue or number of Territories that are missing?
Are some reps over-represented (or under-represented) in your multi-territory wins?
What about lead sources? Multi-territory Deals sourced from Brokers or Consultants aren’t bad, but if you’re not closing them from organic sources, your brand marketing might not be pulling its weight.
See you in the next Lab Report.
In an upcoming Lab Report I’ll deep dive Video Playbook on ways to track territory counts on your Deals. Video Playbooks are available to Paid Subscribers. You’ll also get access to the full archives of the FranDev Lab Report.